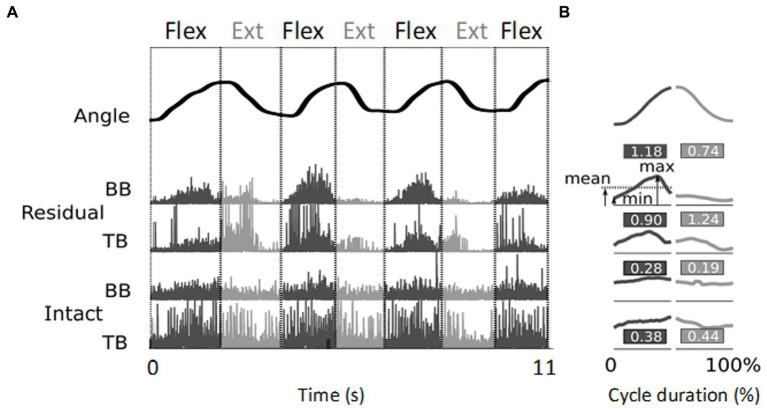
Figure 2.
Illustration of EMG signal processing resulting in relative phasic muscle activity values. (A) The top trace shows the angular evolution of 3.5 cycles of flexion/extension of the little finger executed over 11 s. The four lower traces represent the corresponding rectified EMG activity normalized, for each electrode site, by the maximum value, recorded from the biceps (BB) and triceps (TB) brachialis muscles of the residual arm and intact upper arm, respectively. (B) Mean kinematic traces and EMG envelopes for each half cycle. The duration of each movement half-cycle is normalized to 50% of the total cycle time. The values indicate the relative phasic muscle activity calculated from the signals shown in panel (A) (see text). Note the higher values found for the residual upper arm compared to the intact upper arm.

