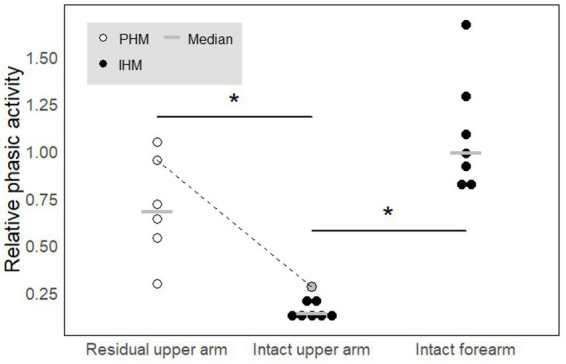
Figure 5.

Relative phasic activity across movement types and electrode sites. A high value indicates a phasic profile while a low value indicated a rather tonic profile. In each condition, each circle represents one participant. White circles correspond to amputees while black filled circles correspond to controls. The gray circle added to the intact arm category corresponds to the results obtained for amputee P6 for whom we recorded the residual and intact upper arms in parallel. The dotted line links the data obtained for P6 in the two conditions. The gray horizontal lines represent median values. * indicates significant differences (p < 0.05). See text for precise p-values.
