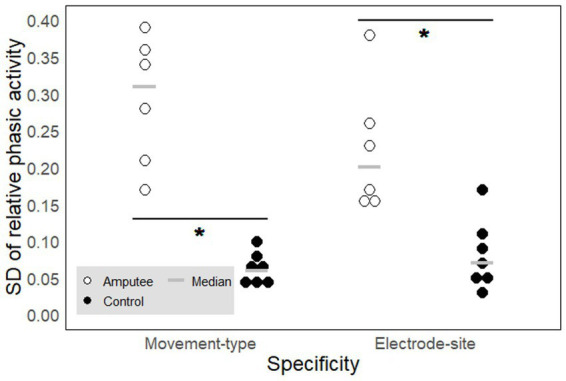
Figure 6.

Movement-type and electrode-site specificity of the phasic muscle activity. Each circle represents one participant. The signals were measured on the upper arm for phantom (PHM, amputees, empty circles) and intact (IHM, controls, filled circles) hand movements and expressed in SD of the relative phasic muscle activity. A high SD value reflects a high specificity. The gray horizontal lines represent median values. * indicates significant differences between the two groups (see results section for precise p-values).
