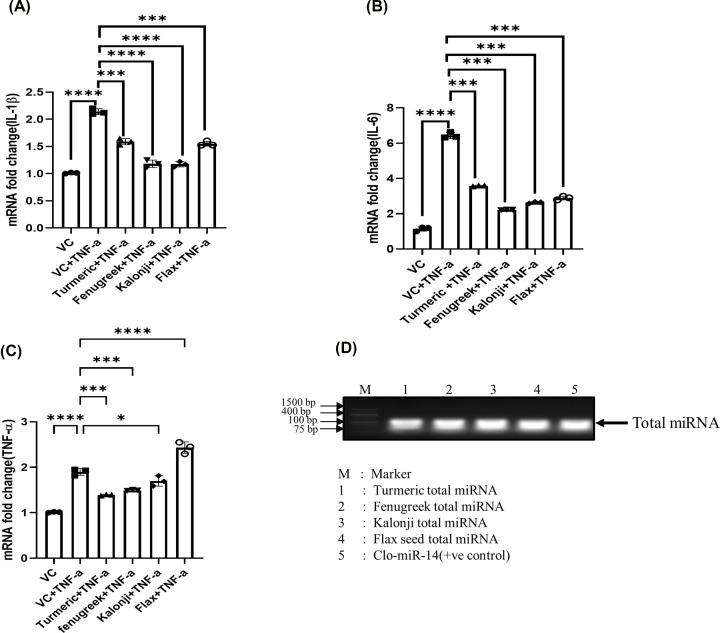
Figure 1. The anti-inflammatory effect of total miRNA from a medicinal plant has been checked in the SW982 cell line after inflammation induced by TNF induction.
(A) The graph represents the level of IL-1β mRNA fold change, measured after transfection with total miRNA from turmeric, fenugreek, kalonji, and flax seed. (B) The graph represents the level of IL-6 mRNA fold change, measured after transfection with total miRNA from turmeric, fenugreek, kalonji, and flax seed. (C) The graph represents the level of TNF-α mRNA fold change, measured after transfection with total miRNA from turmeric, fenugreek, kalonji, and flax seed. (D) The image showing agarose gel image of total microRNA from turmeric, fenugreek, kalonji, flax seed, and Clo-miR-14. The data were represented from three independent experiments and represented by a bar graph. IL, interleukin; TNF-α, tumor necrosis factor-α; VC, vehicle control; ****P≤0.0001, ***P≤0.001, **P≤0.01, *P≤0.05.

