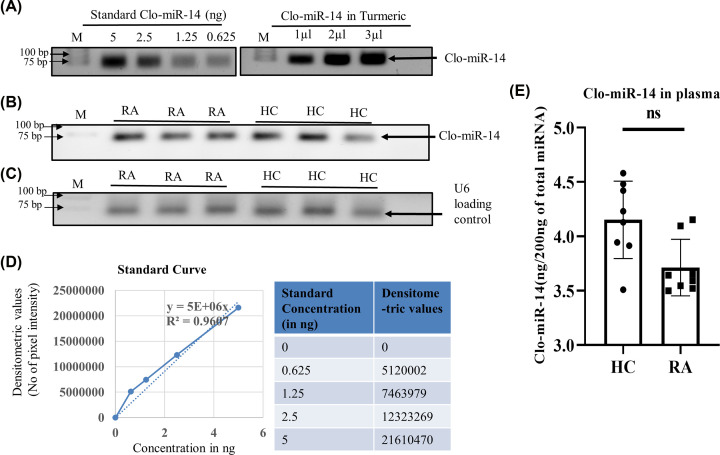
Figure 3. Quantification and validation of miRNA in human plasma.
(A) The image shows bands of Clo-miR-14 PCR product of commercially synthesized Clo-miR-14 using different concentrations used as a standard along with turmeric. (B) The band showing expression of Clo-miR-14 used to measure the concentration of Clo-mir-14 in RA (N=8), and HC (N=8) plasma samples (C) Band showing U6 loading control in RA (N=8) and HC (N=8) plasma samples run on 1.5% agarose gel. (D) The graph shows the standard curve and the table showing the values to generate the standard curve between synthetic Clo-miR-14 concentration and their corresponding densitometry values. Using the slope of the standard curve, Clo-miR-14 concentration was measured in blood plasma and the rhizome of turmeric. (E) The bar graph represents the concentration of Clo-miR-14 in human plasma samples, indicating a non-significant difference in RA (N=8) plasma samples compared with HC (N=8). HC, healthy control; ns, non-significant P-value; M, molecular weight marker; RA, rheumatoid arthritis.

