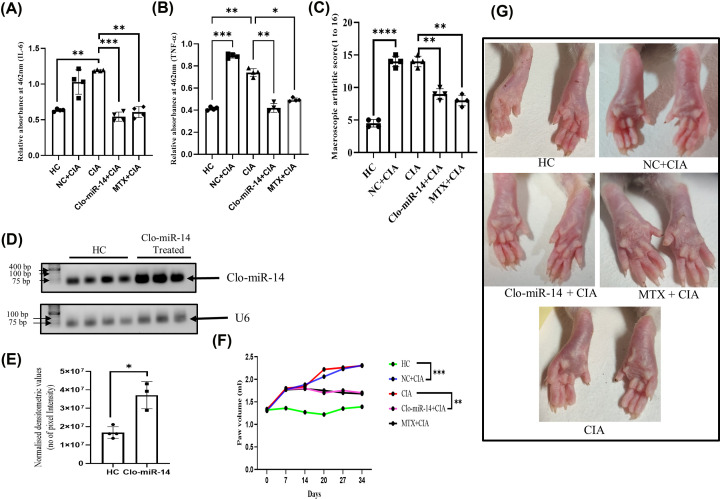
Figure 5. The effect of Clo-miR-14 on collagen-induced arthritis rat model.
(A) The bar graph represents the comparative optical density of IL-6 in rat plasma in HC (N=4), NC (N=4), CIA (N=4), Clo-miR-14 (N=4), and MTX (N=4) rat groups, which shows the downregulation of IL-6 level after Clo-miR-14 treatment compared with the CIA and NC. (B) The bar graph represents the optical density of TNF-α plasma level in rats, shown downregulated in Clo-miR-14 treated group plasma samples compared with the CIA and NC group. (C) The macroscopic arthritic score was measured on the 28th day and represented by a graph based on naked eye observation and swelling (based on measured paw volume by plethysmometer) in the Clo-miR-14 treated group compared with the CIA and NC groups. (D) The image showing the comparative level of Clo-miR-14 miRNA (upper panel) normalized with U6 loading control (lower panel) in rat synovium of HC (N=4) and Clo-miR-14 induced group (N=3). (E) The graph represents the densitometric value of Clo-miR-14 PCR product of Clo-miR-14 treated and HC rat synovium, run in 1.5% agarose gel normalized with U6 loading control which depicts the level of Clo-niR-14 in rat synovium. (F) The paw volume was measured using a plethysmometer from day 0 to day 34, and graphs were plotted to find the changes in paw volume in the Clo-miR-14 treated group compared with the CIA, VC, and MTX groups. (G) Representative hind paw image of the rats from each group, where edema and redness were seen reduced in the Clo-miR-14 and MTX (standard drug) treated group compared with the CIA and NC groups. CIA, collagen-induced arthritis; HC, healthy control; IL, interleukin; M, molecular weight marker; MTX, methotrexate; NC, non-specific miRNA pool control; TNF-α, tumor necrosis factor-α; VC, vehicle control; **P≤0.01, ***P≤0.001, ****P≤0.0001.

