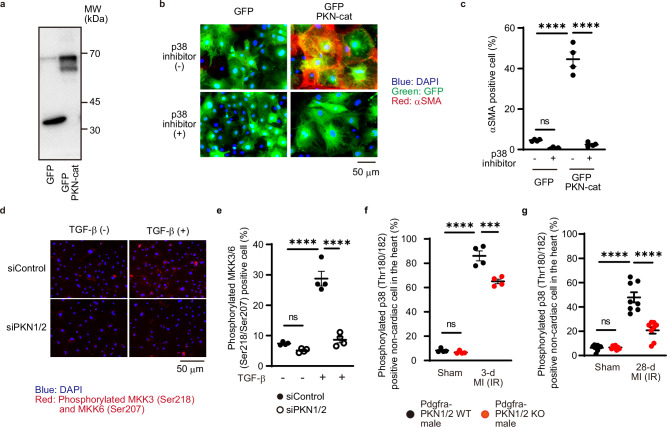
Fig. 7. PKN1/2 knockdown significantly reduced MI-induced p38 phosphorylation.
a Western blot analysis for GFP-PKN-cat expression in cardiac fibroblasts. The results represent three independent experiments. Immunofluorescent images (b. blue, DAPI; green, GFP; red, αSMA) and quantification of the number (c) of αSMA-positive cardiac fibroblasts after overexpression of GFP-PKN-cat and treatment with a p38 inhibitor (10 μM, n = 4, biological replicates per group). ns, not significant; ****p < 0.0001. Immunofluorescent images (d) and quantification of the number (e) of cardiac fibroblasts with phosphorylated MKK3/6 (Ser218/Ser207, red) and DAPI (blue) after siRNA-mediated PKN1/2 knockdown and TGF-β treatment (n = 4, biological replicates per group). ns, not significant; ****p < 0.0001. Immunofluorescent-based quantification of dual-positive cells for PDGFRα and phosphorylated p38 shown as a percentage of PDGFRα-positive cells in the control and ischemia-reperfusion hearts at 3 days (f, n = 4, biological replicates per group) and 28 days (g, n = 8, biological replicates per group) after injury. ns, not significant; ***p = 0.0001; ****p < 0.0001. Data are presented as the mean ± SEM and analyzed with two-way ANOVA followed by Tukey’s post hoc test (c, e, f, g). The data represent three independent experiments with similar results. Source data are provided as a Source Data file.

