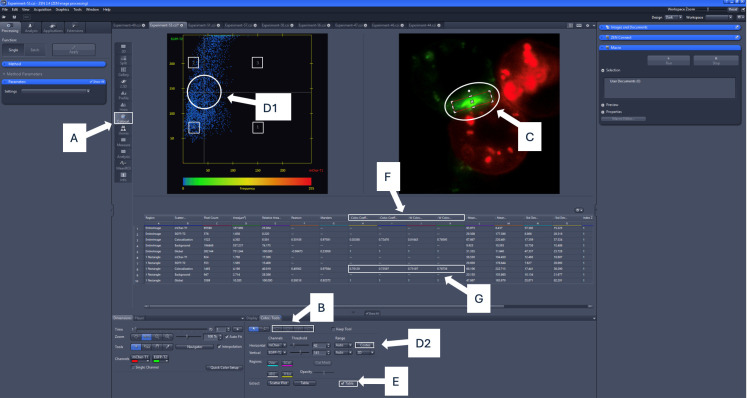
Figure 4. Colocalization analysis using ZEN Blue software.
Areas of note are highlighted in white (colocalization tab, threshold adjustment bars, quadrant numbers, region of interest indicator, colocalization coefficients, region of interest tool, Costes auto threshold button, table option). For the example image, the colocalization coefficient to be recorded is 0.725, and the weighted colocalization coefficient to be recorded is 0.767, indicating that 72.5% of GFP-PD-1 signal colocalizes with mCherry-PD-L2 without taking into account pixel intensity, and 76% of GFP-PD-1 signal colocalizes with mCherry-PD-L2 when taking into account pixel intensity. A) Click on the colocalization option on the sidebar. B) Select the region of interest (ROI) using the shape tools. C) Appropriately position the ROI over the synapse and ensure it remains selected. D1) Either manually adjust the bars on the cytofluorogram, or D2) Click the Costes button to auto-set the threshold bars with the selected region of interest using the mouse. E) Click the table option to view the values for the localization coefficients. F) Unweighted and weighted colocalization coefficient values will be listed from left to right (Colocalization Coefficient 1, Colocalization Coefficient 2, W Colocalization Coefficient 1, W Colocalization Coefficient 2). G) Colocalization coefficient values for the region of interest (synapse) will be displayed in the table.

