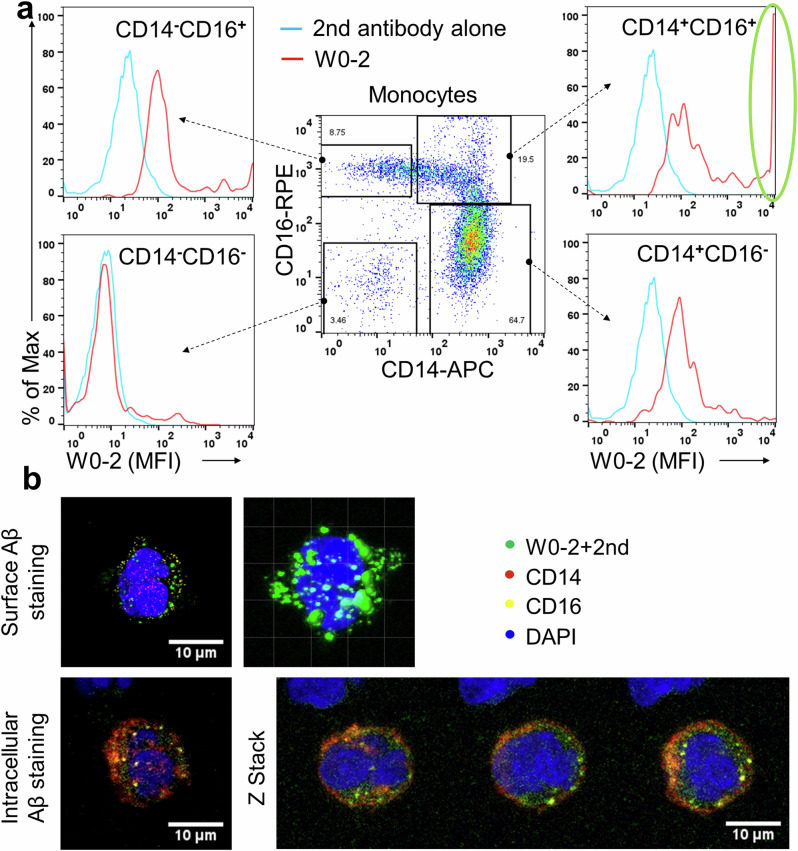
Fig. 1. The flow cytometry-based assay.
a Flow cytometry dot plot outlined monocyte subsets based on CD14 and CD16 expression, displaying surface Aβ detection on monocytes via W0-2 and secondary antibodies in the histograms. b Confocal microscopy displayed Aβ peptides on the surface and cytoplasm of intermediate monocytes, identified by CD14 and CD16 (n = 3). Intracellular Aβ was observed using the 6E10 mAb and captured through Z-stack imaging (n = 2). Nuclei were counter-stained with DAPI. MFI: The mean fluorescence intensity.

