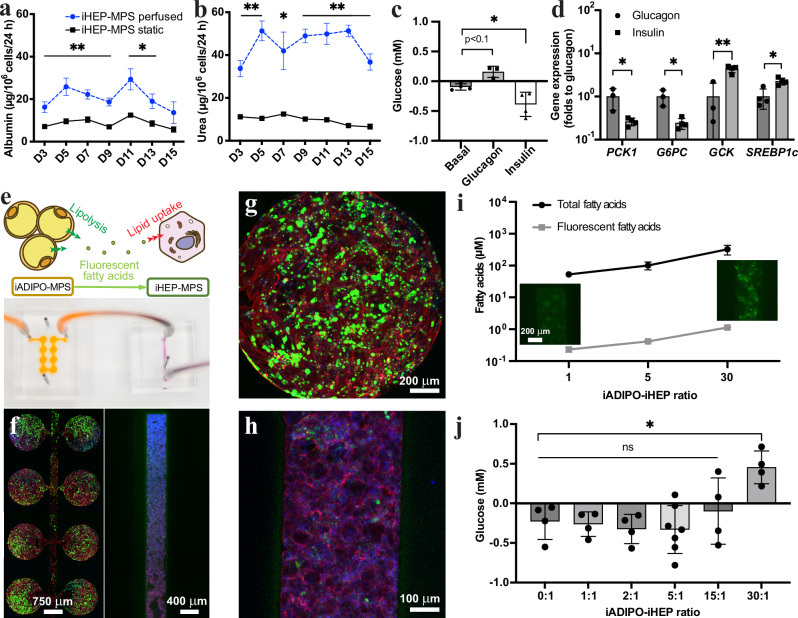
Fig. 1. Interconnection and scaling of iHEP-MPS and iADIPO-MPS.
a, b Albumin (a) and urea (b) in media of iHEP-MPS under perfused (blue dashed line) and static (black solid line) conditions for 15 days. n = 14, 12, 12, 14, 5, 10, 5 in the perfused conditions and n = 13, 14, 14, 11, 5, 11, 7 in the static conditions for D3-D15 in (a). n = 3 in all conditions in (b). n referring to media collected from both conditions. p-values were calculated by unpaired two-tailed t-tests for the comparison of perfused vs static each day. c, d Glucose in media (c) (n = 4 for Basal, Insulin; n = 3 for Glucagon) and metabolic gene expression in iHEPs (d) (n = 4 except n = 3 for Glucagon PCK1, G6PC, GCK) of iHEP-MPS after 1 h hormonal stimulation. n referring to media in (c) and MPS in (d). p-values were calculated by one-way ANOVA followed by Tukey’s test in (c) and by unpaired two-tailed t-tests in (d). e Schematic and photo of interconnected iADIPO-MPS and iHEP-MPS. f–h Representative fluorescent images of iADIPO-MPS (left image in f, g) and iHEP-MPS (right image in f, h). Blue, nuclei; red, F-actin; green, fatty acids. i Total non-esterified fatty acid and fluorescent fatty acid concentrations in media at different iADIPO-iHEP ratios. Insets show representative fluorescent images of iHEP-MPS at 1:1 and 30:1 ratios. n = 3 except n = 4 for Total fatty acids 1,5. n referring to media. Two-tailed correlation test shows Pearson r = 0.9996 and p = 0.0173 between total and fluorescent fatty acids. j Glucose levels in media of 1 h insulin-stimulated iHEP-MPS 48 h after interconnection with iADIPO-MPS at different cell ratios. n = 4 except n = 7 for 5:1. n referring to media. p-values were calculated by one-way ANOVA then Dunnett’s test. All data are mean ± SD. *p < 0.05; **p < 0.005; ns, p > 0.05. Statistical methods and exact p-values are shown in Supplementary Data 1. Source data are provided as Source Data file.

