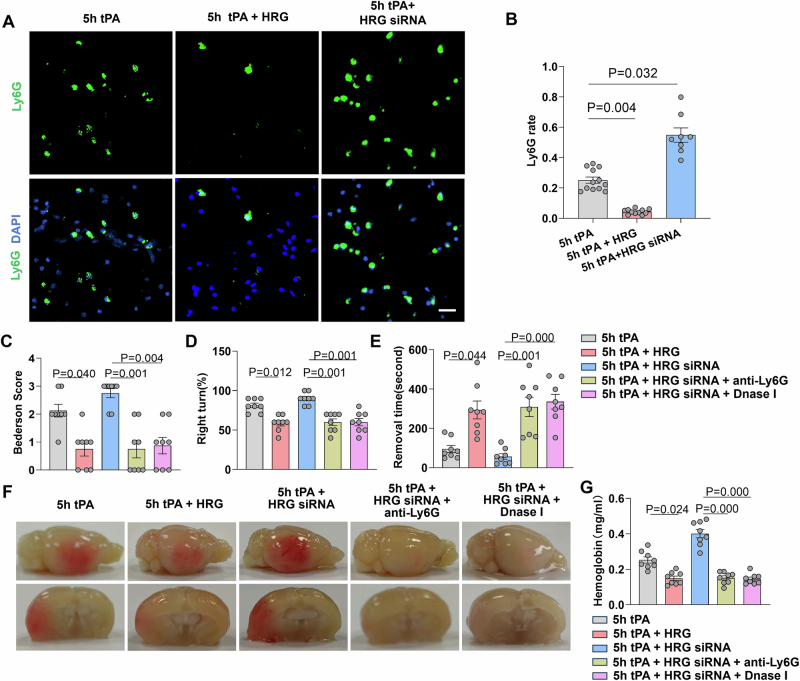
Figure EV3. Endogenous HRG depletion exacerbates hemorrhagic transformation and neurological deficits, which are rescued by neutrophil depletion or NETosis inhibition.
(A) Representative images of immunofluorescence staining of infiltrating neutrophils (Ly6G, green) in brain lesions. Scale bar = 20 µm. (B) The statistical analysis of infiltrating neutrophils (Ly6G rate) from the following experimental groups: tPA (5 h) (n = 12), tPA (5 h) + HRG (n = 11), and tPA (5 h) + HRG siRNA groups (n = 8). The data are also partially used in Fig. 6H. (C–E) Neurological deficits were measured by assessing the Bederson score (C), corner test (D) and adhesive removal test (E) in mice treated with tPA (5 h), tPA (5 h) + HRG, tPA (5 h) + HRG siRNA, tPA (5 h) + HRG siRNA + anti-Ly6G, and tPA (5 h) + HRG siRNA + Dnase I (n = 8 per group). (F) Representative images of the dorsal surface and a coronal section showing cerebral hemorrhage 24 h after stroke. (G) Quantification of cerebral hemorrhage by spectrophotometric hemoglobin assay (n = 8). Data information: Data are presented as mean ± SEM. Two-tailed Kruskal–Wallis H test is used in (B–E, G). Source data are available online for this figure.

