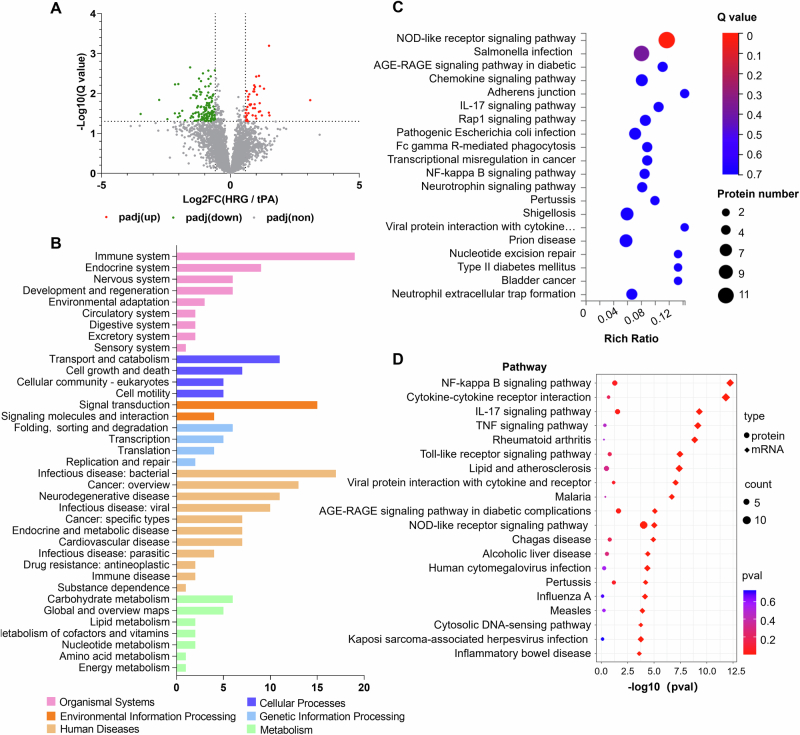
Figure EV4. Proteomic analysis and correlated differentially expressed genes and proteins of neutrophilia under HRG treatment.
(A) The protein profiles of neutrophils under tPA + HRG vs. tPA treatments were analyzed by the data-independent acquisition (DIA) mode (n = 6 per group). DEPs between two groups were identified as the padj <0.05 and fold change >1.5. The volcano plots are shown. (B) The downregulated DEPs were analyzed by KEGG classification in neutrophils with tPA + HRG vs. tPA treatment groups. (C) Bubble plot of KEGG pathway analysis of downregulated DEPs. Rich ratio represents the ratio of the number of target proteins vs. all proteins included in each pathway. Dot size represents the relative number of enriched proteins. The color of the dot represents the size of the Q-value (padj). (D) KEGG pathway enrichment analysis of correlated (Cor)-DEGs-DEPs. The enrichment of the proteomics is represented by circles, while the enrichment of the transcriptomics is represented by diamonds. Dot size represents the relative number of enriched proteins. The color of the dot represents the size of the Q-value (padj). For statistical methods, we performed hypergeometric test and Benjamini-Hochberg correction for Q-value (padj). We performed KEGG functional enrichment for DEGs and DEPs by clusterProfiler R package (3.8.1).

