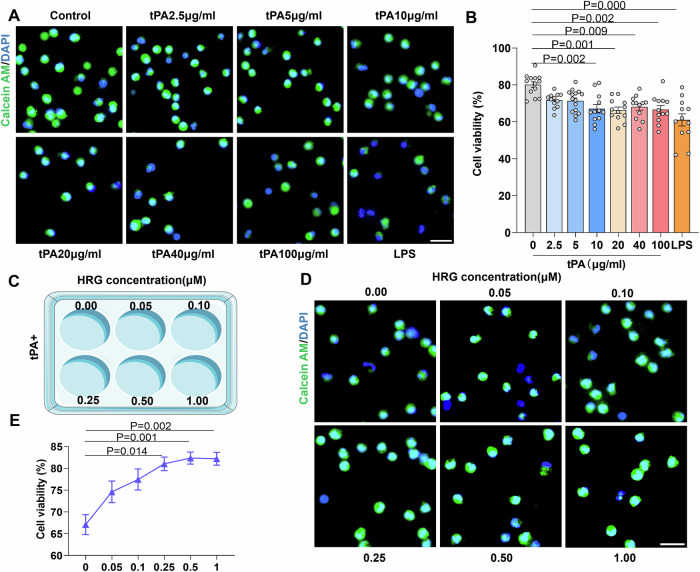
Figure 3. HRG increases the cell viability of purified human neutrophils after tPA treatment.
(A) The neutrophils were labeled with calcein-AM (living cell, green) and Hoechst 33342 (nuclei, blue). Graded concentrations of tPA were added to the culture system with LPS (10 μg/ml) added as the positive control. After 18 h of culture, the viability of neutrophils was observed and calculated under a fluorescent microscope. Typical results from five independent experiments are shown. Scale bar = 20 µm. (B) Statistical analysis of the cell viability is shown (n = 12–15). (C) Schematic diagram illustrating the experimental design. (D) The culture system was treated with 10 μg/ml tPA and different concentrations of HRG (0.05 μM, 0.1 μM, 0.25 μM, 0.5 μM, 1 μM), and the viability of neutrophils was observed by calcein-AM staining. Scale bar = 20 µm. (E) The concentration-response curves of the effects of HRG on neutrophil mortality rate (0 μM, n = 12; 0.05 μM, n = 13; 0.1 μM, n = 15; 0.25 μM, n = 12; 0.5 μM, n = 14; 1 μM, n = 13). Data information: Data are presented as mean ± SEM. Two-tailed Kruskal–Wallis H test is used in (B, E). Source data are available online for this figure.

