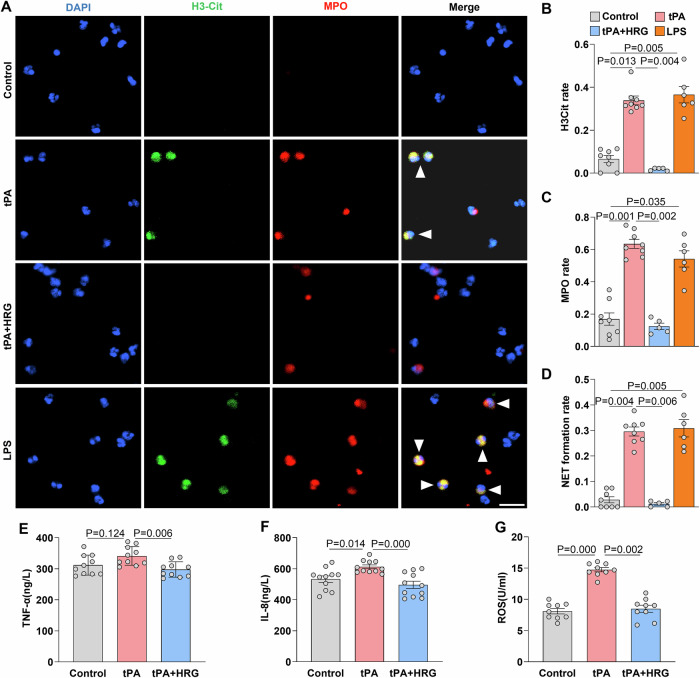
Figure 4. HRG reduces NETosis and cytokine production of neutrophils after tPA stimulation.
(A) Representative images of isolated peripheral blood neutrophils treated with tPA (10 μg/ml), tPA + HRG (1 μM), and LPS (10 μg/ml). Neutrophils were incubated for 2.5 h and co-stained with H3Cit (green), MPO (red), and DAPI (blue). White arrows indicate NET formation. Scale bar = 20 µm. (B–D) Statistical analysis and comparison of H3Cit, MPO, and NET formation rates in different groups (n = 5–8). The results shown are the mean ± SEM. (E–G) The concentration of TNF-α (n = 10), IL-8 (n = 11), and ROS (n = 9) in the supernatant of the culture system was quantified by ELISA. Data information: Data are presented as mean ± SEM; two-tailed Kruskal–Wallis H test is used in (B–G). Source data are available online for this figure.

