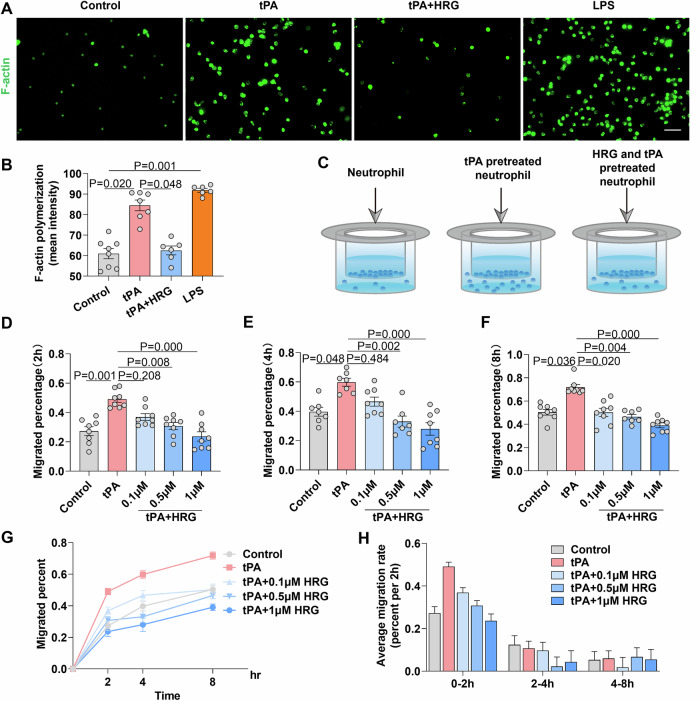
Figure 5. HRG inhibits neutrophil polymerization of F-actin and migration across the BBB in vitro.
(A) The polymerization of F-actin in neutrophils was observed under a fluorescent microscope by staining with phalloidin (cytoskeleton, green) and Hoechst 33342 (nuclei, blue). The cells were observed at 2.5 h after stimulation with tPA (10 μg/ml), tPA (10 μg/ml) + HRG (0.5 μM), and LPS (10 μg/ml). Scale bar = 20 µm. (B) Quantitative analysis of F-actin immunofluorescence intensity under different conditions (n = 6–8). (C) Schematic diagram illustrating the experimental design. Transwell membrane inserts were coated with collagen IV and fibronectin, and hCMEC/D3 cells were seeded onto them followed by 4 h of hypoxia-glucose deprivation. Neutrophils pretreated with different factors (tPA: 10 μg/ml, HRG: 0.1 μM, HRG: 0.5 μM, and HRG: 1 μM) for 2 h were added to the upper chamber. After 2 h (D) (n = 8), 4 h (E) (n = 7–8), and 8 h (F) (n = 7–8) of culture, the number of neutrophils in the lower chamber was counted. Migration percentage = the number of neutrophils in the lower chamber/the total number of neutrophils added to the upper chamber. (G) The line graph summarizes the migrated percentage of neutrophils at 2 h, 4 h, and 8 h (n = 6–8). (H) The average migration rate of neutrophils during the 0–2 h, 2–4 h, and 4–8 h of the transwell assay. Data information: Data are presented as mean ± SEM; two-tailed Kruskal–Wallis H test is used in (B, D–F). Source data are available online for this figure.

