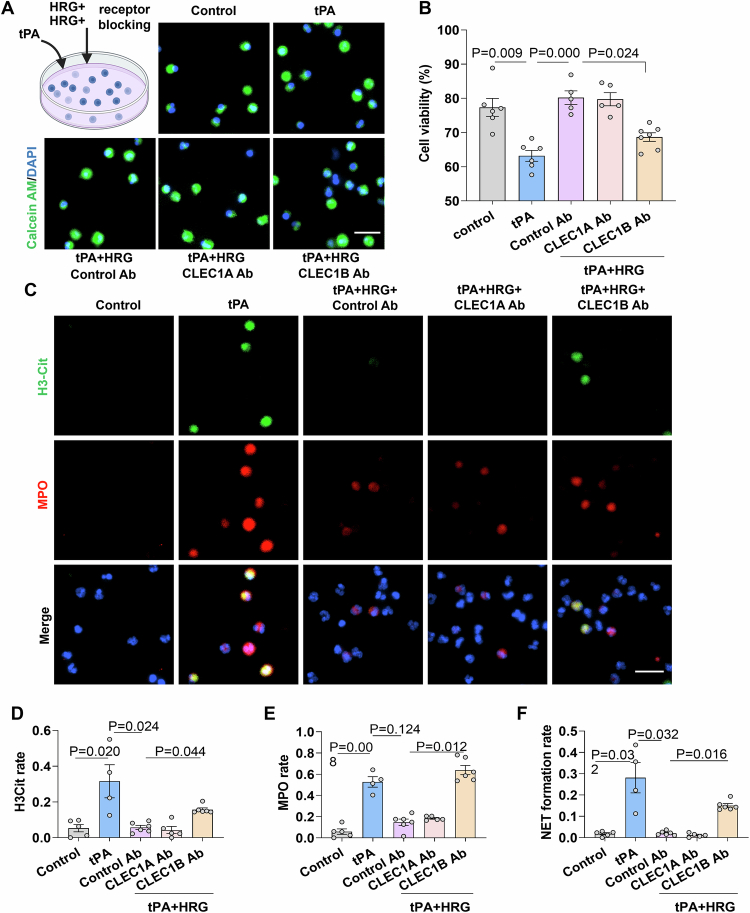
Figure EV2. Effect of CLEC1A and CLEC1B blockade on the mortality rate and NETosis of neutrophils in response to tPA and HRG treatment in vitro.
(A) Neutrophils were labeled with calcein-AM (living cell, green) and Hoechst 33342 (nuclei, blue). Neutrophils were cultured under the following conditions: vehicle, tPA, tPA + HRG + Control Ab, tPA + HRG + blocking antibodies against CLEC1A and CLEC1B. After 18 h of culture, the viability of neutrophils was observed and calculated under a fluorescent microscope. Typical results from five independent experiments are shown. Scale bar = 20 µm. (B) Statistical analysis of the cell viability is shown (n = 5–7). (C) Neutrophils were incubated for 2.5 h and co-stained with H3Cit (green), MPO (red), and DAPI (blue). Merged images indicate NET formation. Scale bar = 20 µm. (D–F) Statistical analysis and comparison of H3Cit, MPO, and NET formation rates in different experimental groups (n = 4–6). Data information: Data are presented as mean ± SEM. Two-tailed Kruskal–Wallis H test is used in (B, D–F). Source data are available online for this figure.

