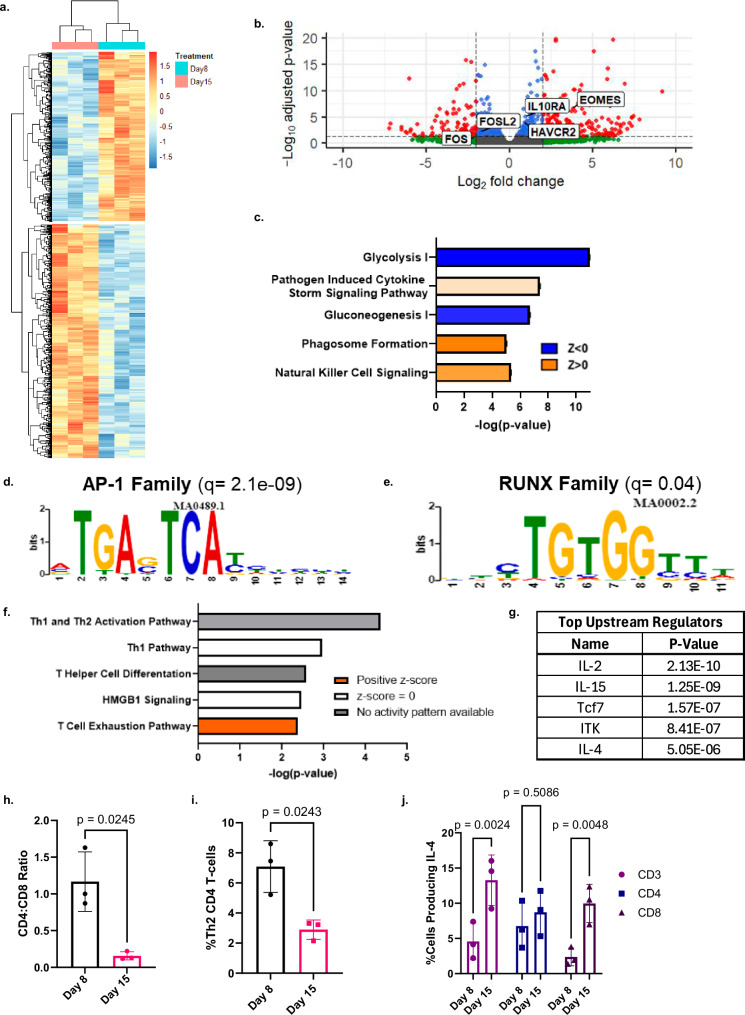
Fig. 3. Transcriptomic and chromatin accessibility interrogation reveals a role for IL-4 in the development of CART cell exhaustion that is independent of its classical role in Th2 polarization.
a, b Heat map and volcano plot showing differentially expressed genes when comparing chronically stimulated (Day 15) to baseline (Day 8) CART19-28ζ cells (DESEQ2 with three biological replicates, padj < 0.05). In the volcano plot, significantly differentially expressed genes (padj < 0.05) are colored red. c Top differentially regulated pathways as determined by QIAGEN IPA of differentially expressed genes (DESEQ2 with three biological replicates, padj < 0.05). d, e Motifs enriched in chronically stimulated as compared with baseline CART19-28ζ cells (MEME/TOMTOM analysis with three biological replicates). f, g Top canonical pathways and upstream regulators as identified by QIAGEN IPA of genes that were both differentially expressed (DESEQ2 with three biological replicates, padj < 0.05) and differentially accessible (DiffBind with DESEQ2 using three biological replicates, padj < 0.05). h Ratio of CD4+ to CD8+ CART19-28ζ cells in baseline (Day 8) and chronically stimulated (Day 15) cell populations from the in vitro model for exhaustion (Paired two-sided t test, average of two technical replicates for three biological replicates, mean ± SD). i The percent of CD4+ CART19-28ζ cells that are Th2 polarized as determined by CCR6-CCR4+CXCR3- via flow cytometry in baseline (Day 8) and chronically (Day 15) stimulated CART19-28ζ cell populations (Paired two-sided t test, average of two technical replicates for three biological replicates, mean ± SD). j The percent of either CD3+, CD4+, or CD8+ CART19-28ζ cells producing IL-4 as determined by intracellular staining for IL-4 by flow cytometry following four hours of antigen-specific CAR stimulation through co-culturing Day 8 or Day 15 CART19-28ζ cells with JeKo-1 cells at a 1:5 effector-to-target (E:T) cell ratio (Two-way ANOVA, average of two technical replicates for three biological replicates, mean ± SD). Source data for (h–j) are provided in the Source Data file.

