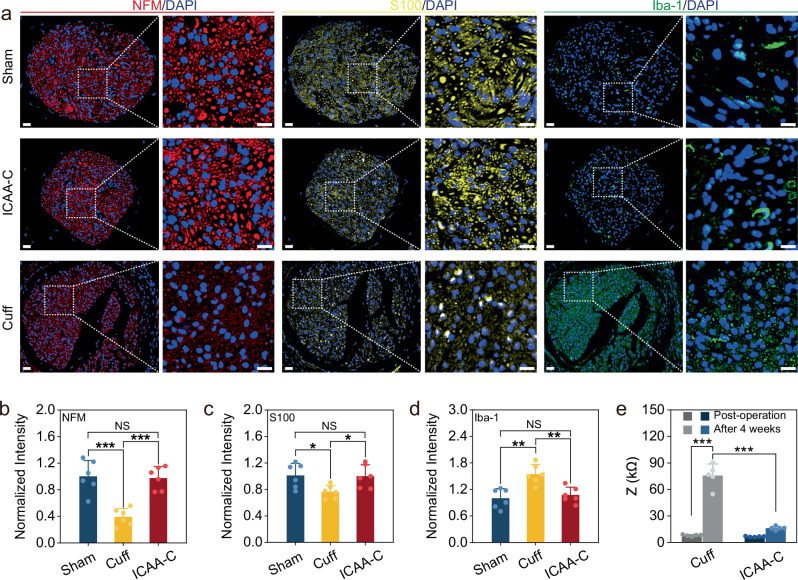
Fig. 4. Stable neural interface constructed by ICAA-C.
a Representative immunofluorescence photographs of the vagus nerves at 4 weeks post-implantation in ICAA-C, commercial cuff (diameter of 300 μm), and sham group. The images are magnified ×45 (left), ×175 (right) to show the white dotted regions of the nerves. Scale bar, 20 μm (left), 10 μm (right). b–d Normalized fluorescence intensity of neurofilaments (NFM) (b), Schwann cells (S-100) (c), and macrophages (Iba-1) (d) in ICAA-C, commercial cuff (300 μm), and sham group, respectively (n = 6 independent animals). ICAA-C implantation shows reduced tissue damage with less inflammatory response in contrast to commercial cuff implantation. e Impedances at 1 kHz of the ICAA-C and commercial cuff electrode (diameter of 300 μm) post-operation and 4 weeks after implantation (n = 5 independent animals). ICAA-C shows minimal impedance change, unlike the commercial cuff electrode group, which exhibits a ~9.5-fold increase post-implantation. Data are presented as the mean ± standard deviation in (b–e) and were analyzed by one-way ANOVA first, and then by the Tukey′s post hoc test. *p ≤ 0.05, **p ≤ 0.01, ***p ≤ 0.001. NS not significant. b p = 1.25 × 10⁻⁴ (Cuff vs Sham), p = 0.9703 (ICAA-C vs Sham), p = 1.93 × 10⁻⁴ (ICAA-C vs Cuff). c p = 0.0395 (Cuff vs Sham), p = 0.992 (ICAA-C vs Sham), p = 0.0495 (ICAA-C vs Cuff). d p = 1.05 × 10⁻³ (Cuff vs Sham), p = 0.8123 (ICAA-C vs Sham), p = 3.57 × 10⁻³ (ICAA-C vs Cuff). e p = 0 (Cuff (Post-operation) and ICAA-C (After 4 weeks) vs Cuff (After 4 weeks)).

