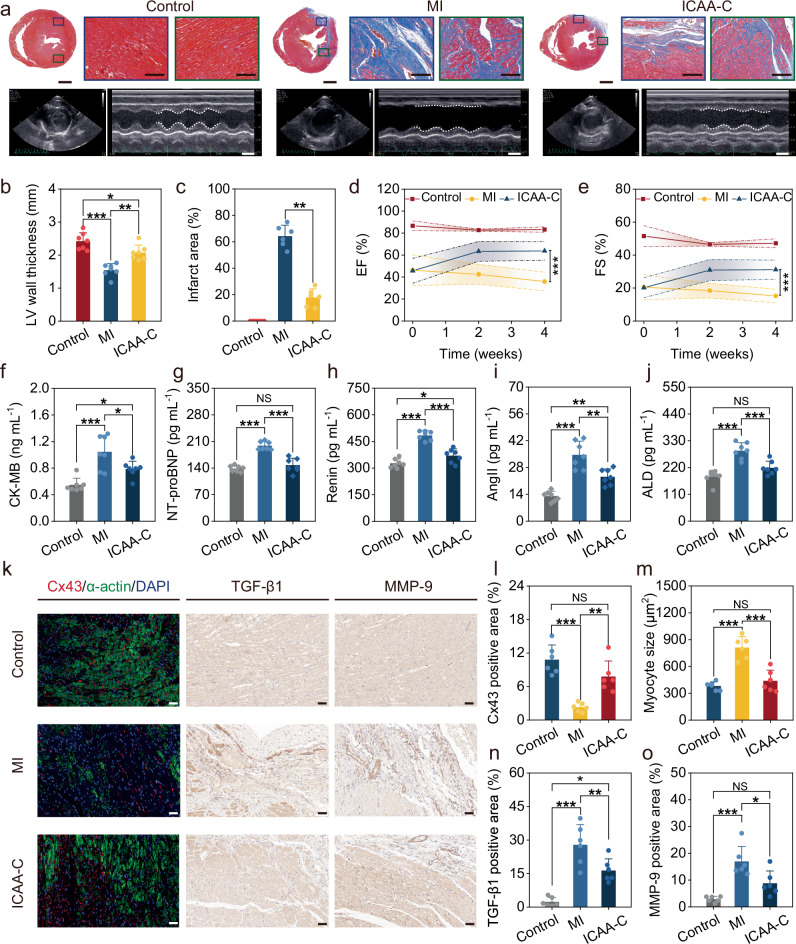
Fig. 5. The ICAA-C-based chronic vagus nerve stimulation allows for effective MI therapy.
a Masson staining shows collagen deposition (blue), with echocardiography images highlighting left ventricle (LV) size changes at the papillary muscle level during systole and diastole. Scale bar, 2 mm, and 200 μm for Masson staining, and 5 mm for echocardiography, respectively. b, c Quantitative analysis of LV wall thickness (b) (n = 7 independent animals) and infarcted area (c) (n = 6 independent animals). d, e Ejection fraction (EF) (d) and fraction shortening (FS) (e) of LV at 1 day, 2 weeks, and 4 weeks post-operation (n = 7 independent animals). f–j Serum level of creatine kinase-MB (CK-MB) (f), N-terminal pronatriuretic peptide (NT-proBNP) (g), Renin (h), angiotensin II (Ang-II) (i), aldosterone (ALD) (j) at 4 weeks post-operation (n = 7 independent animals). k Immunofluorescence and immunohistochemical images for cardiac markers (α-actin), Connexin 43 (Cx43), transforming growth factor beta 1 (TGF-β1) and matrix metallopeptidase 9 (MMP-9). Scale bar, 50 μm. l–o Quantitative analysis of Cx43 (l), myocyte size (m), TGF-β1 (n), and MMP-9 (o) (n = 7 independent animals). Data are presented as the mean ± standard deviation and were analyzed by one-way ANOVA first, and then by the Tukey′s post hoc test. *p ≤ 0.05, **p ≤ 0.01, ***p ≤ 0.001. NS not significant. p1 (MI vs Control), p2 (ICAA-C vs Control), p3 (ICAA-C vs MI) b p1 (3.43 × 10⁻⁶), p2 (0.02878), p3 (0.00117). c p3 (0.0015). d p3 (2.14 × 10⁻⁶). e p3 (6.24 × 10⁻⁶). f p1 (1.04 × 10⁻⁴), p2 (0.0441), p3 (0.0292). g p1 (2.47 × 10⁻⁷), p2 (0.4393), p3 (2.59 × 10⁻⁶). h p1 (1.02 × 10⁻⁸), p2 (0.0414), p3 (4.48 × 10⁻⁶). i p1 (5.92 × 10⁻⁷), p2 (0.00363), p3 (0.00125). j p1 (5.82 × 10⁻⁶), p2 (0.0769), p3 (7.26 × 10⁻⁴). l p1 (2.86 × 10⁻⁵), p2 (0.0858), p3 (0.00215). m p1 (8.36 × 10⁻⁶), p2 (0.6128), p3 (4.3 × 10⁻⁵). n p1 (8.20 × 10⁻⁶), p2 (0.00337), p3 (0.0135). o p1 (1.08 × 10⁻⁴), p2 (0.0699), p3 (0.012).

