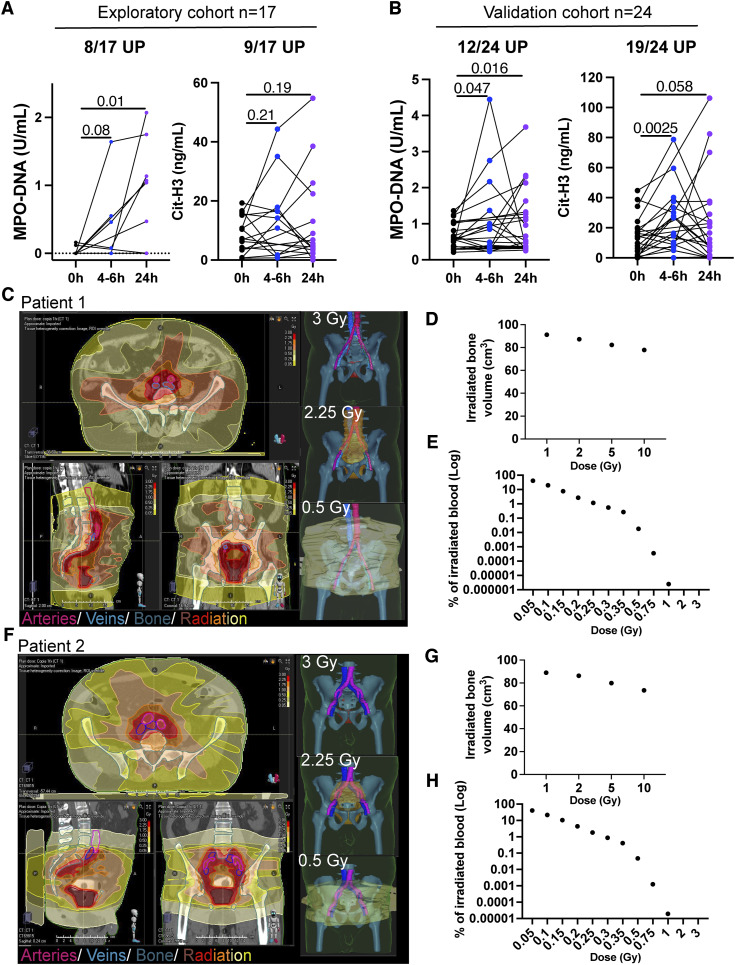
Figure 4.
Patients undergoing radiotherapy experience increases in circulating NETs. Blood of patients with cancer undergoing their first radiotherapy treatments (Supplementary Table S1) was drawn immediately before the radiotherapy session, in some cases 4–6 hours after the radiotherapy treatment and in most cases, 24 hours later. MPO–DNA complexes and CitH3 were measured by ELISAs to quantify circulating NETs in a prospective exploratory cohort (A) and in a second prospective confirmatory cohort (B). Patients with high levels of circulating levels of NETs (the top quartile) prior to radiotherapy were excluded from the analyses to avoid confusion with NETs induced by other factors. The proportion of patients who underwent at least a 30% increase in circulating NETs at any of the time points is indicated above each graph. One-tail paired t tests were used to account for statistical significance. C, Images of a representative patient showing the dosimetry curves depicting the amount of radiation received by the tumor lesion and surrounding tissues after one fraction of a radiotherapy course. Isosurfaces in 3D and different 2D projections show the radiated area by different intensities in red to yellow color. Large vessels and bone tissue are overlaid in purple/blue and teal, respectively. D, Bone volume irradiated by the indicated irradiation doses. E, Estimations of the percentage of irradiated blood with the indicated irradiation doses after his/her first single session of radiotherapy are shown. F and H, Representative dosimetry curves (F), percentage of the irradiated bone (G), and estimations of irradiated blood (H) of another patient included in the study.

