
FIGURE 3.
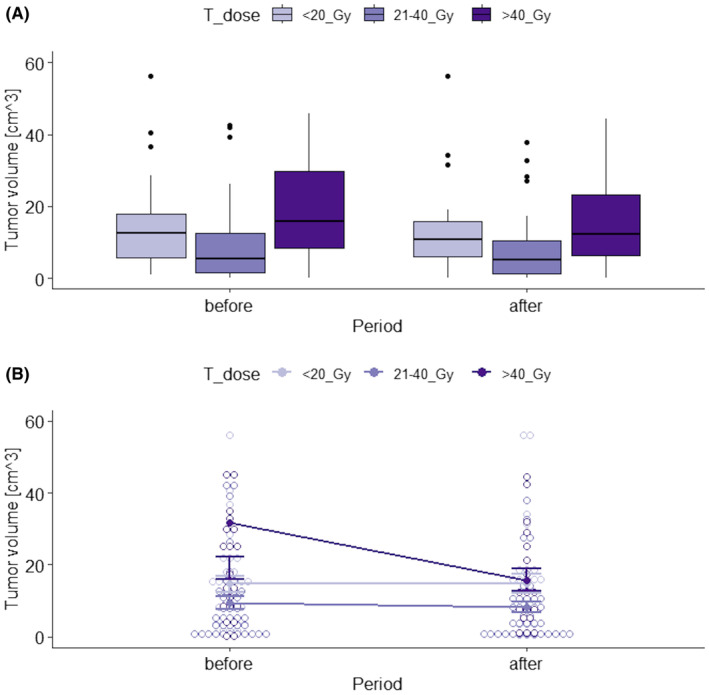
Box plots (A) and interaction plot (B) of tumor volume by RTH total dose and observation period.
Official websites use .gov
A
.gov website belongs to an official
government organization in the United States.
Secure .gov websites use HTTPS
A lock (
) or https:// means you've safely
connected to the .gov website. Share sensitive
information only on official, secure websites.
Box plots (A) and interaction plot (B) of tumor volume by RTH total dose and observation period.