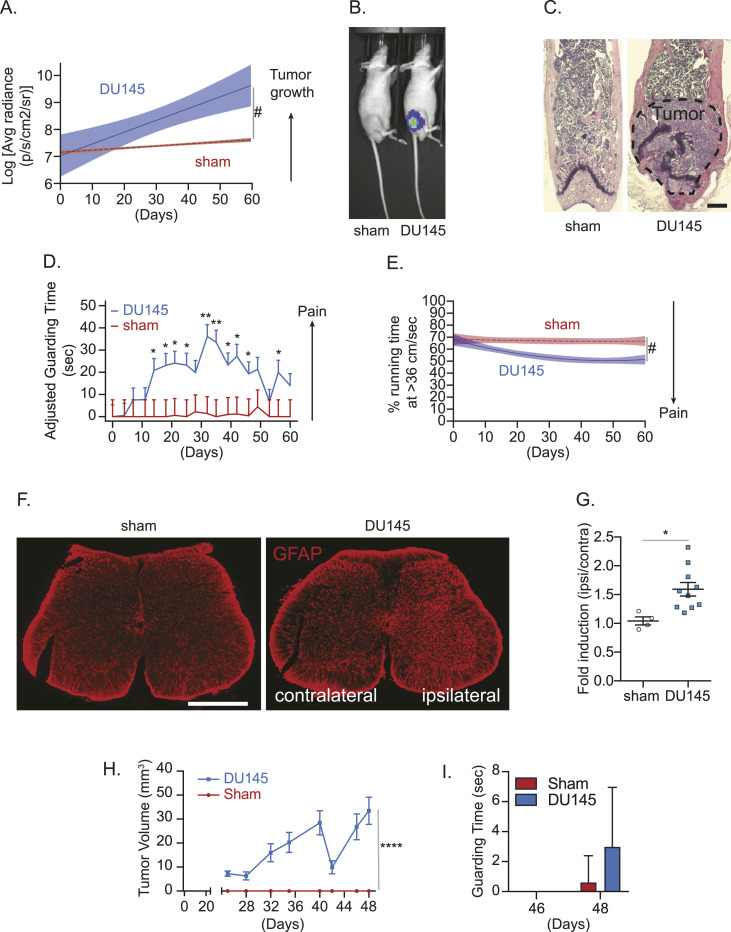
Figure 1. In vivo cancer–induced bone pain model.
Luciferase-expressing human prostate cancer cell line DU145 or conditioned medium (sham) was implanted directly into femurs of nude mice. (A) Bioluminescence imaging (BLI) was performed to measure tumor growth (n = 10/group). Data are the mean ± 95% confidence interval (CI). (#P ≤ 0.05 [time-by-group interaction] versus sham group [mixed-effects models]). (B) Representative bioluminescent images of sham- and luciferase-labeled DU145 cell–injected mice (week 8). (C) H&E staining of the femur of animals in (A, B). ×20. Bar = 500 μm. (D) Pain behaviors were measured by (D) guarding behavior measurement (mean ± SEM. (E) *P ≤ 0.05 and **P ≤ 0.01 versus sham group [mixed-effects models]) and (E) the running wheel assay (percent of time running at the optimal velocity of 36 cm/sec or greater) (#P ≤ 0.05 [time-by-group interaction] versus sham group [group-averaged growth curve models]). (F) Representative images of glial fibrillary acidic protein–immunostained spinal cord of animals in (A, B). ×10. Bar = 500 μm. (F, G) Quantification of (F). Data are the mean ± SEM. *P ≤ 0.05 versus sham group (t test). (H) Tumor volume measured by a caliper. Data are the mean ± SEM. ****P ≤ 0.0001 versus sham group (two-way ANOVA). (I) Guarding behavior measurement. Data are the mean ± SEM; P ≤ 0.05 is considered as statistically significant (t test).

