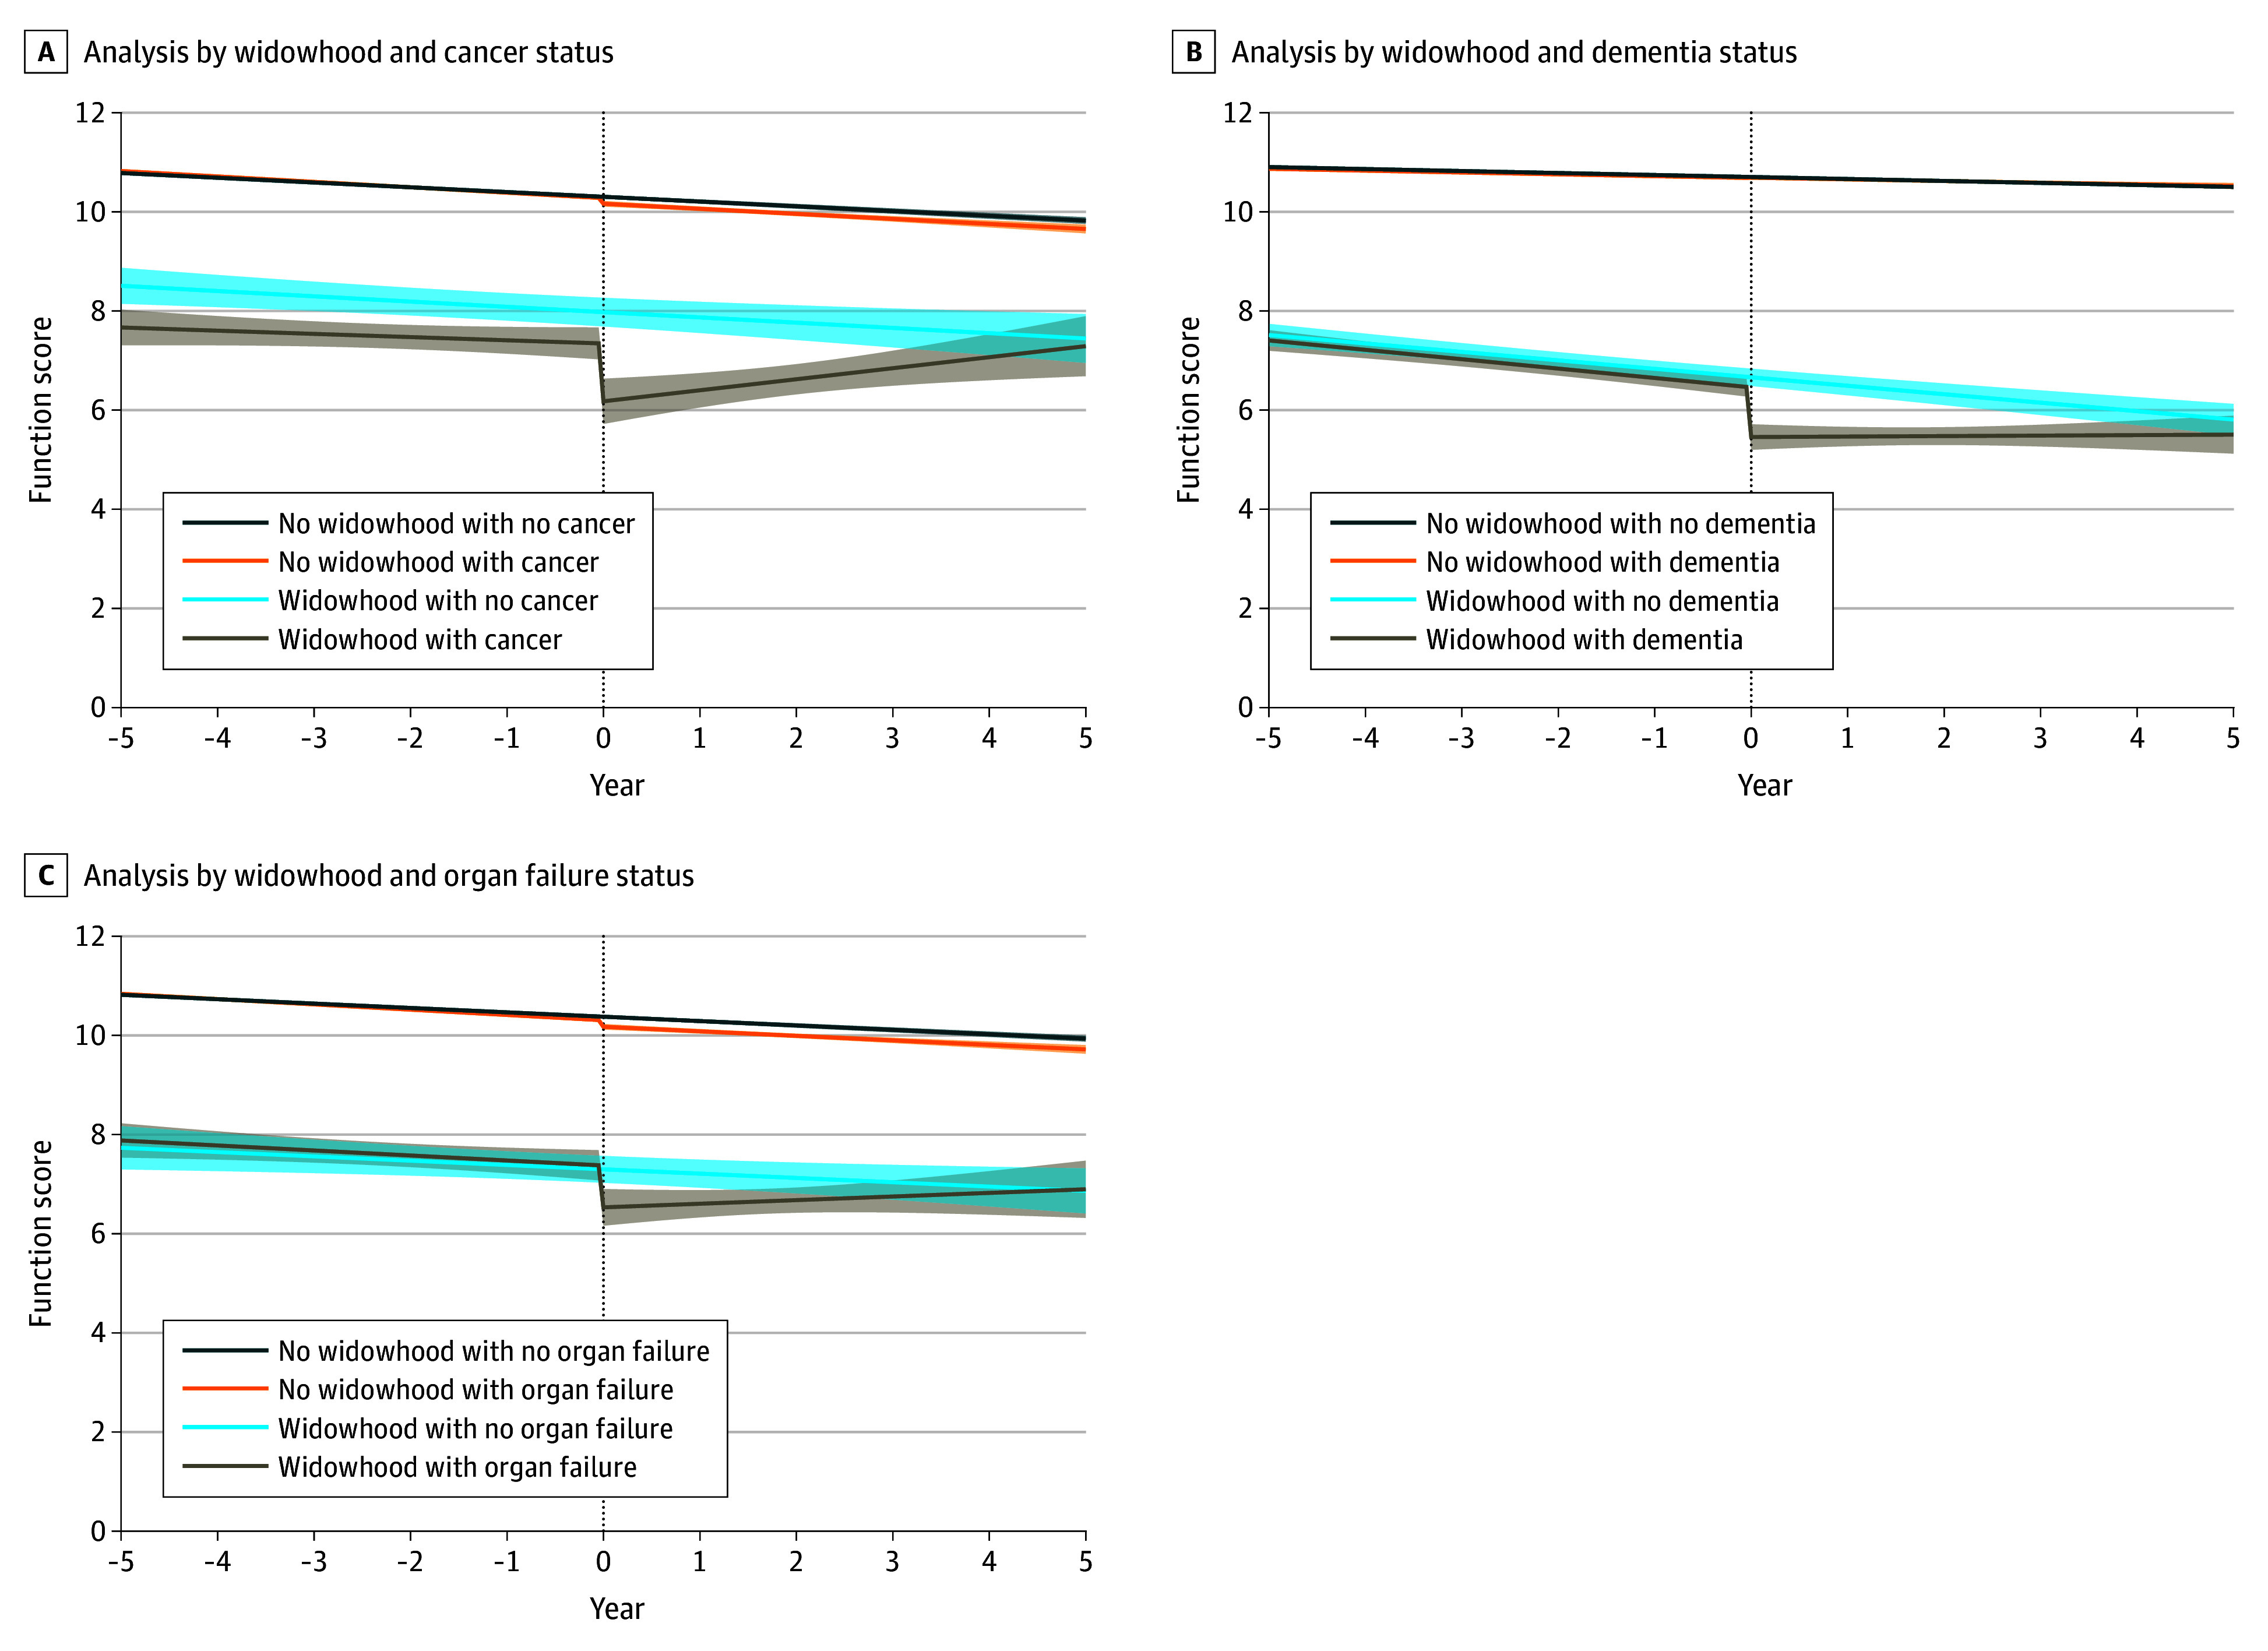
Figure 1. Matched Spline Regression of Function Following Real or Simulated Widowhood Event for People With and Without Cancer, Dementia, or Organ Failure .

Among people with cancer (A), there were no significant differences in the slopes for those with and without widowhood events (pre-event: P = .71; postevent: P = .07). Among people with dementia (B), there were no significant differences in the slopes for those with and without widowhood events (pre-event: P = .78; postevent: P = .11). Among people with organ failure (C), there were no significant differences in the slopes for those with and without widowhood events (pre-event: P = .90; postevent: P = .35). Dashed line represents time of actual or simulated widowhood event; shading, 95% CI.
