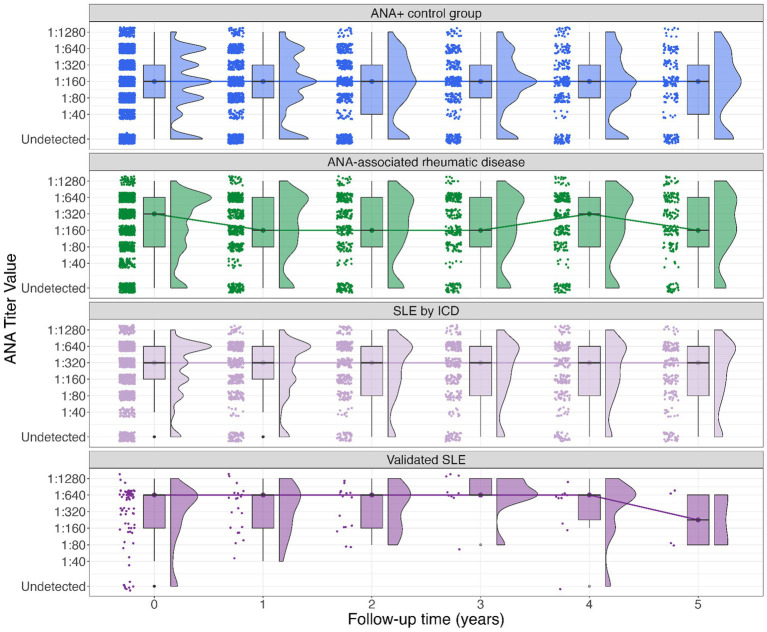
Figure 1.
Boxplot of ANA titer among groups (SLE by ICD, validated SLE, other rheumatic diseases, and ANA+ controls). The Y-axis denotes the ANA titer closest to each yearly timepoint*, the X-axis denotes time in years elapsed from baseline (time 0) to 5-year follow-up. Dots and lines denote group medians and their change over time. The upper and lower bound of each box represent the 75 and 25% quantiles, respectively. The histograms to the right side of each box show the frequencies for each titer. *The median elapsed time between each yearly assessment and the actual time of ANA assessment ranged from 1.7 to 4.7 months.

