
FIGURE 1.
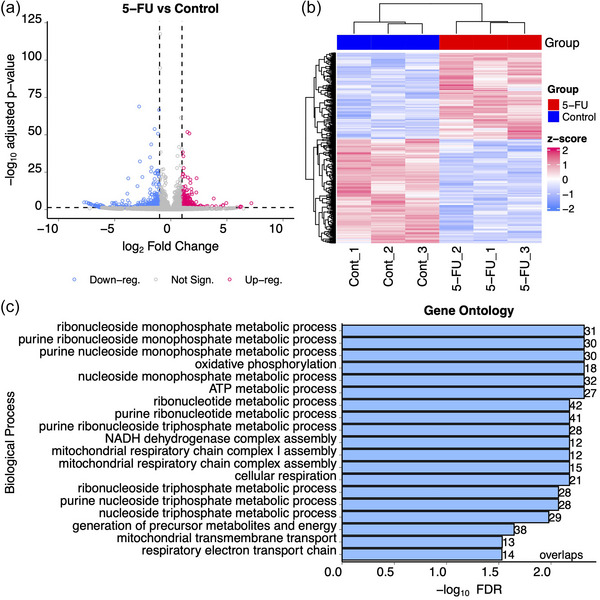
Differential gene expression in DLD‐1 cells after exposure to 5‐FU. DLD‐1 cells were exposed or not to 10 uM 5‐FU for 48 h in the absence of serum after which RNA was isolated and RNAseq was performed on transcripts > 200 nt. (a) Volcano plot showing up‐ and down‐regulated genes after treatment with 5‐FU. Blue dots show downregulated genes and red dots show upregulated genes with at least 2‐fold changes in expression and adjusted p values < 0.05. Grey dots represent transcripts whose expression did not significantly change after 5‐FU treatment. (b) Hierarchical clustering analysis was performed on triplicate RNAseq samples prepared from DLD‐1 cells treated (red) or not (blue) with 5‐FU. The heat map shows up‐ (red) and down‐ (blue) regulated genes. (c) Gene ontology analysis was performed using the WebGestaltR package to identify overlaps between gene annotation sets after exposure to 5‐FU (Wang et al., 2017).