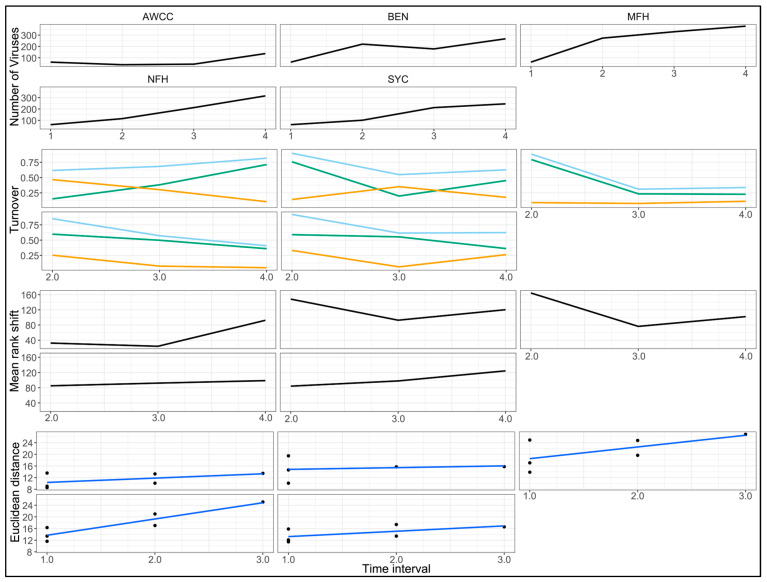
Figure 6.
Changes in freshwater mussel virome composition at 4 river sites (Clinch River sites BEN and SYC, Middle Fork Holston River (MFH), North Fork Holston River (NFH)), and the Aquatic Wildlife Conservation Center (AWCC) hatchery over 3 sampling intervals in 2021. Top row: number of viruses. Second row: virome turnover plots showing total turnover rate (light blue line), disappearance rate (orange line), and appearance rate (green line). Third row: mean rank shifts representing the degree of virus abundance reordering between time points. Fourth row: rate of virome community change. Note that the top plot includes four values, including the baseline value from the outset of the study, while all other plots contain three values, representing observed changes from the previous interval.

