FIG. 4.
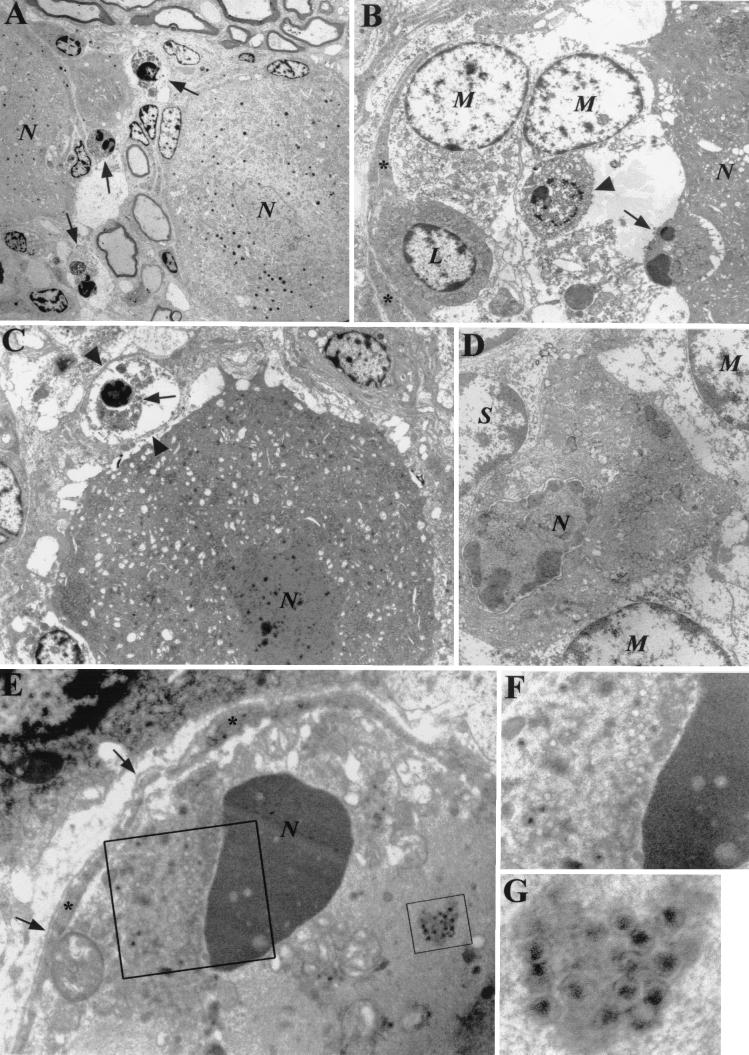
Transmission electron microscopy of TG at 48 hpi (A) and 72 hpi (B to G). (A) Apoptotic lymphocytes (arrows) in the connective tissue between two neurons (N). (B) Inflammatory cells within the enlarged space between a neuron (N) and its satellite cells (asterisks). The macrophages (M) show morphological features of necrosis, and one of them contains a partially degraded lymphocyte within its cytoplasm (arrowhead). An apoptotic lymphocyte (arrow) with highly condensed nuclear fragments and a healthy lymphocyte (L) can also be identified. (C) A moderately degraded apoptotic lymphocyte (arrow) is surrounded by thin cytoplasmic projections (arrowheads) of a satellite cell, which indicates phagocytosis. An infected neuron (N) is shown. (D) A TG neuron (N) exhibiting advanced pathological changes is surrounded by a satellite cell (S) and two macrophages (M). The infected neuron shows margination of nuclear chromatin and convolution of the nuclear outline. (E) Apoptotic neuron displaying a condensed cytoplasm and a highly condensed nucleus (N). A surrounding satellite cell (asterisks) with its basal lamina (arrows) is displayed. (F and G) Details of boxed areas in panel E under higher magnification. (F) Empty and DNA-containing capsids measuring 100 nm in diameter in the cytoplasm of the apoptotic neuron. (G) Aggregate of naked nucleocapsids. The original negatives were digitized with a scanner (Epson GT-7000 photo), and brightness and contrast were corrected by using the graphic program Adobe Photoshop 4.0 for Windows. Original magnifications, ×1,000 (A), ×2,500 (B and D), ×4,000 (C), and ×10,000 (E).

