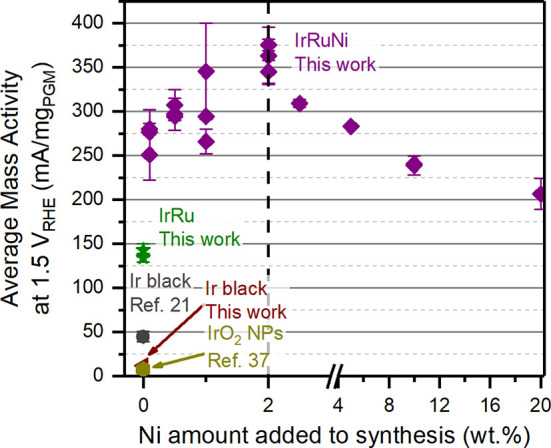
Figure 6.

OER activity per mass of PGM (Ir and Ru) measured by chronoamperometry at 1.5 V vs RHE, plotted against the wt % of Ni present during catalyst synthesis. Data from IrRuNi (purple) and IrRu (green) from this work are compared to an Ir black benchmark from this work (red), as well as literature data from Ir black21 and IrO2 NPs.37 Each data point represents a unique catalyst synthesis, while error bars represent ±σ from at least two individual measurements. Measurements were performed in N2-saturated 0.1 M HClO4 using an RDE setup.
