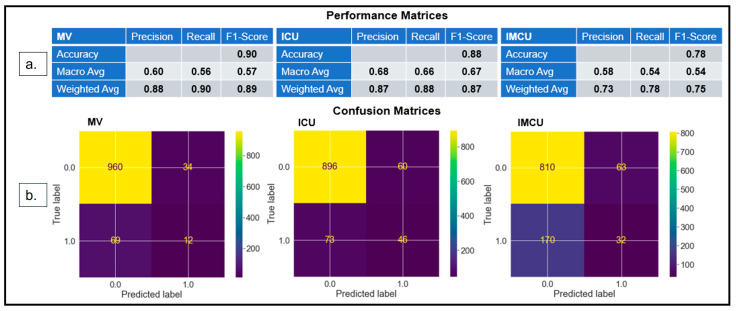
Figure 2.
(a) Performance matrices show that the models’ performances in the test dataset yield an F1-score of 0.89 for MV, 0.87 for ICU admission, and 0.75 for IMCU. (b) Confusion matrices demonstrate that the models correctly classify 972 instances for MV, 942 instances for ICU, and 842 instances for IMCU.

