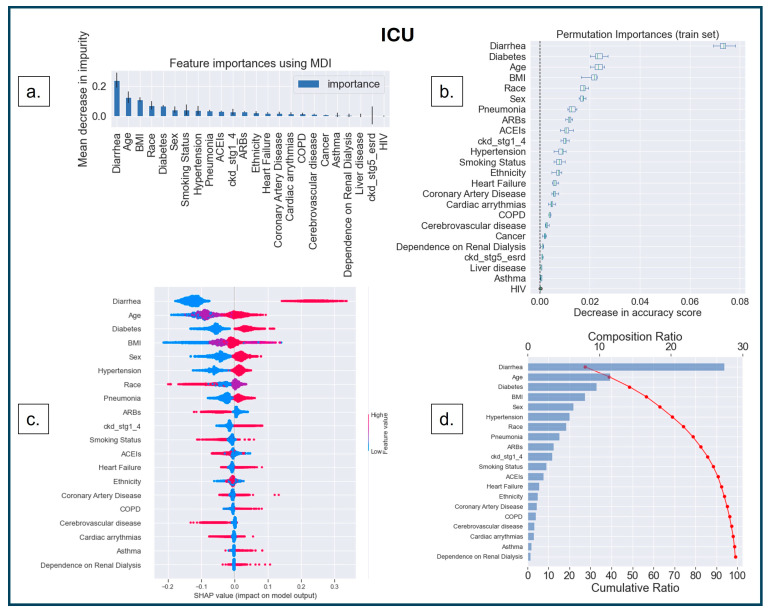
Figure 5.
Feature interpretation. (a) Feature importance using MDI in ICU; the most important features are depicted in the higher bars. (b) Features ranked (Y-axis) based on the decrease in accuracy (X-axis) under the effect of permutations. The ‘bee swarm plot’ (c) shows that the most important feature is diarrhea, followed by age, diabetes, BMI, and sex, the top 5 most important features in ranking order for predicting ICU. The ‘Waterfall plot’ (d) indicates that diarrhea results in a composition ratio of >25% (X-axis, top). Furthermore, the top 12 features accumulate 90% of the model’s cumulative ratio (X-axis, bottom).

