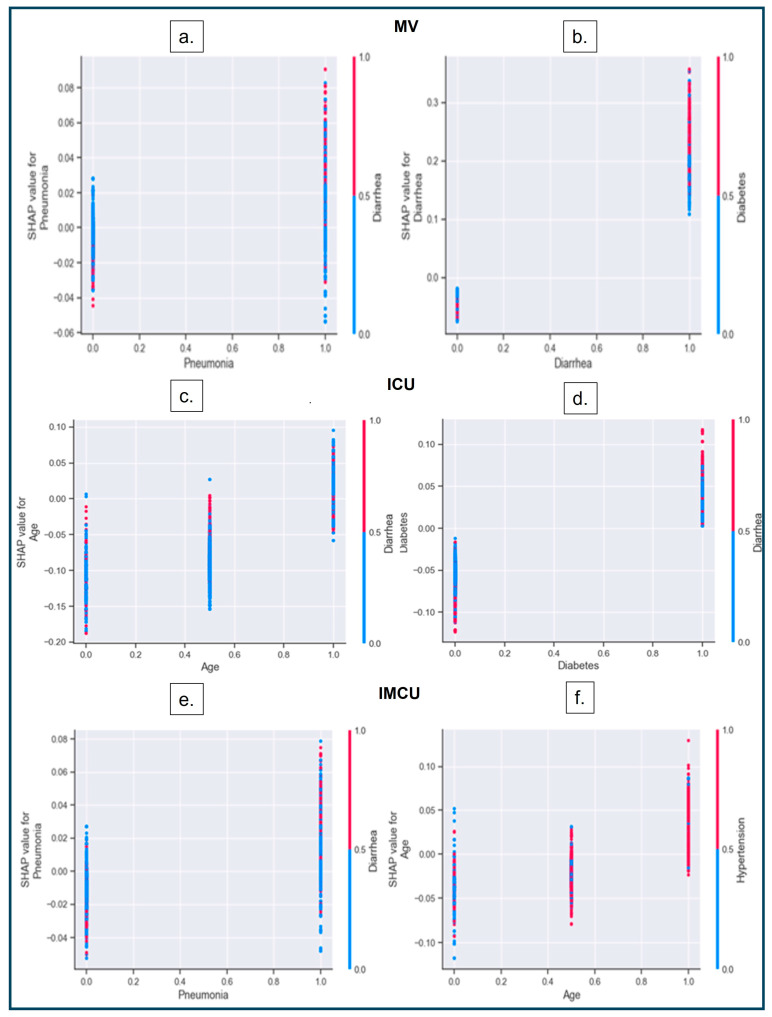
Figure 7.
SHAP dependence plot. (a,b) Interactions between pneumonia–diarrhea and diarrhea–diabetes have a higher impact on predicting MV. An increase in the interaction between diarrhea (red dots) and pneumonia (scattered dots on the right) impacts the model’s output (higher SHAP values). (a) Higher density of red dots in the presence of pneumonia (indicated as categorical values on the x−axis), resulting in an increased likelihood of MV (shown as greater SHAP values) during the presence of two variables. (c,d) Interactions between age–diarrhea and diabetes–diarrhea have a higher impact on predicting ICU admissions. In (c), younger and middle-aged adults, diarrhea shows a sharp rise in prediction (higher SHAP values with red dots); however, diarrhea does not affect the older population much (less density of red dots). The X-axis of (c) represents the three different age categories (‘younger, ‘middle’, and ‘older’ adults). (e,f) Interactions between pneumonia–diarrhea and age–hypertension have higher impacts on predicting IMCU admissions.

