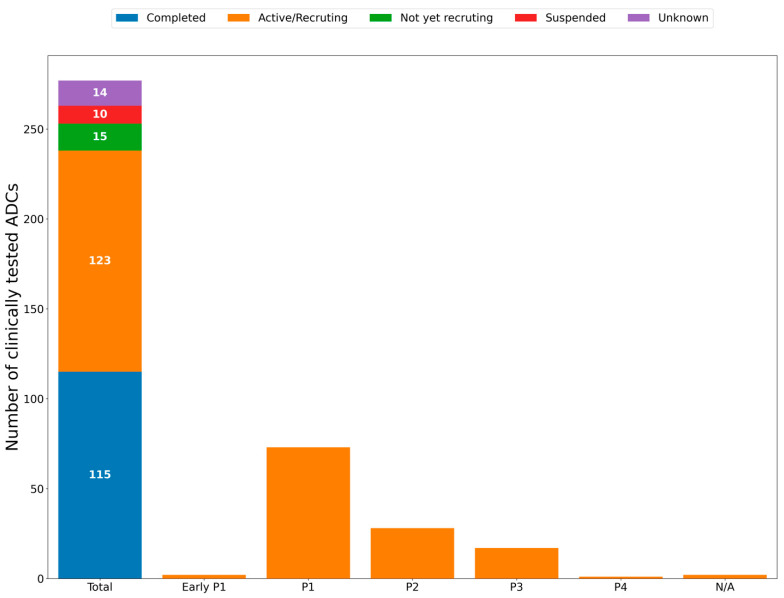
Figure 1.
Clinically tested ADCs. This bar graph shows the 277 ADCs that have undergone clinical trials along with their trial status (completed, active/recruiting, not yet recruiting, suspended, and unknown). Additionally, to the right of the main Total bar, the active/recruiting ADCs are broken down into additional columns to highlight their highest developmental stage (phases 1–4 [P1–P4]).

