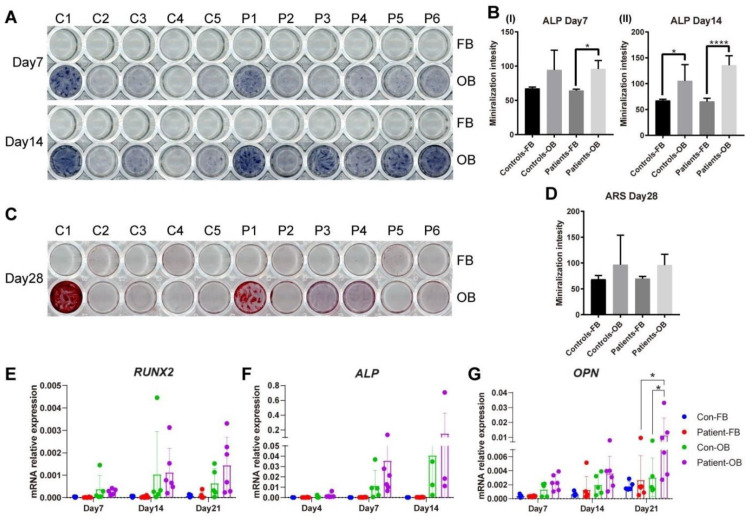
Figure 6.
Osteogenic transdifferentiation potential of PLS3 patient-variant fibroblasts. Primary fibroblasts from healthy donors and PLS3-variant patients were subjected to osteogenic transdifferentiation (OB); undifferentiated fibroblasts (FB) were grown in fibroblast medium. (A) Photos show representative results for stainings performed in 11 primary fibroblast cell lines and their transdifferentiated counterparts (C1–C5, P1–P6). Positive ALP staining (purple) on day 14 indicates ALP activity. (B) Quantification of the intensity of ALP staining. Bars indicate the mean of the staining and error bars the standard deviation. (C) ARS staining (red) on day 28 indicates calcium phosphate deposits. (D) Quantification of the intensity of ARS staining. (E–G) Relative gene expression was measured by qPCR for (E) RUNX2, (F) ALP, and (G) OPN. GAPDH was used to normalize gene expression (* p < 0.05, **** p < 0.0001 as measured by ANOVA).

