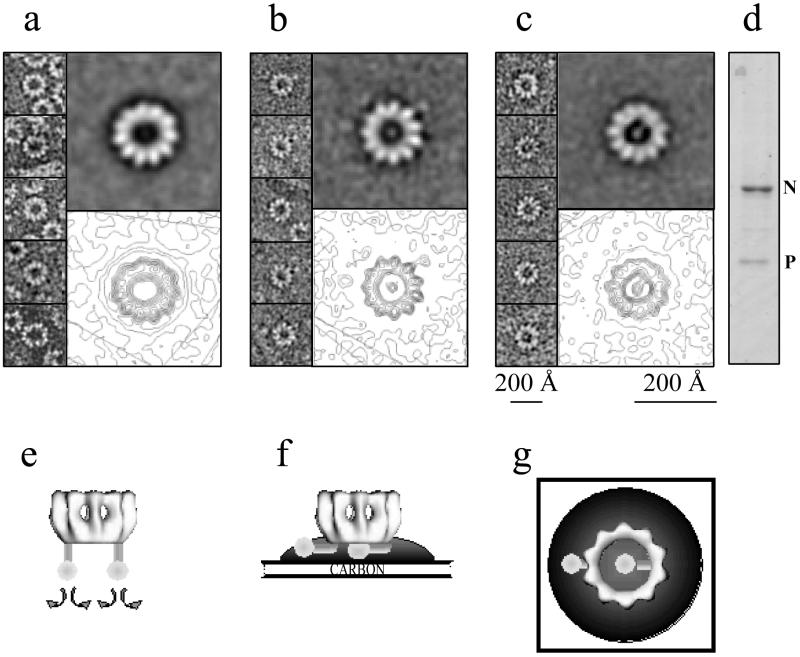
FIG. 5.
Visualization of P bound to N-RNA rings by negative staining with sodium silicotungstate. (a to c) Galleries in the left parts of selected top views of N-RNA rings with 11 monomers of N and in the right parts at the top the averages of 10 raw images. The lower right parts show the same averages but with contour levels in order to outline the connection between P and the N-RNA rings. (a) N-RNA rings without P. (b) N-RNA rings with P sticking out from the rings (but also with some density inside). (c) Rings with one P oligomer inside the ring. Calibration bars indicate the sizes of the raw images (smaller bar) and of the averaged images (larger bar). (d) SDS-PAGE (stained with Coomassie blue) of the complexes, showing that they contain more N than P. Panels e to g represent cartoons of our interpretation of the images in panels a to c. (e) N-RNA-P complex in solution (shown upside down). (f) Side view of the N-RNA-P complex bound to carbon film and embedded in a stain drop. (g) Top view of the situation in panel f.

