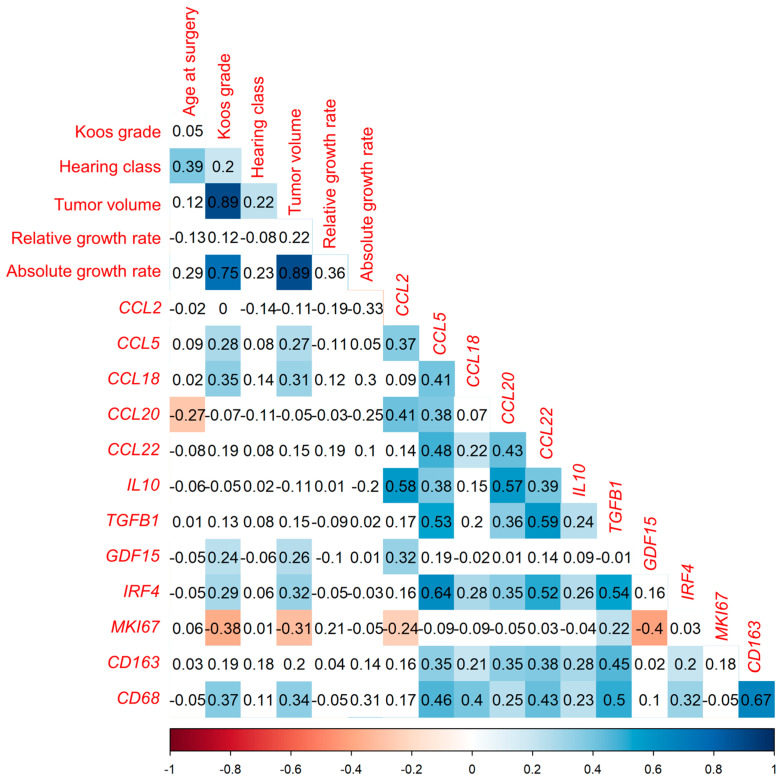
Figure 2.
Correlation analysis of the indicated markers and clinical parameters in 144 VS tumor samples using Spearman’s rank test. Depicted is the correlation between the mRNA levels of the 10 examined markers and age as well as Koos grade of 144 patients, and the correlation of marker levels with hearing class in 143 patients and with tumor volume in 124 patients. The correlation coefficient r is shown. Significant negative correlations (p < 0.05) are plotted in red and significant positive correlations (p < 0.05) in blue. Non-significant correlations are plotted uncolored. p-values of correlations were FDR-corrected for multiple comparisons.

