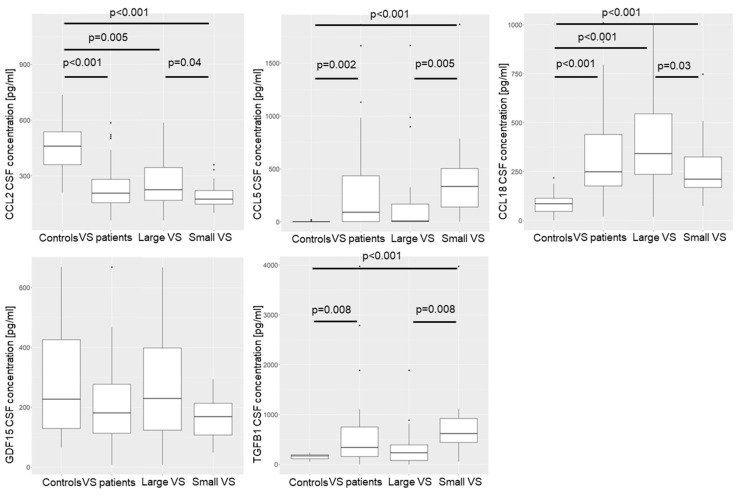
Figure 7.
The concentration of the cytokines CCL2, CCL5, CCL18, GDF15, and TGFB1 in the CSF of a control group (n = 14) was compared with the concentration in the CSF of 52 patients, as well as with the concentration in the CSF of the 20 largest and 20 smallest VSs. A Wilcoxon signed-rank test was performed to compare the groups. The median concentration is marked by the crossbar. The boundaries of the boxes represent the interquartile range, and the whiskers represent 1.5 times the interquartile range. Outliers are presented as dots. p-values of correlations were FDR-corrected for multiple comparisons.

