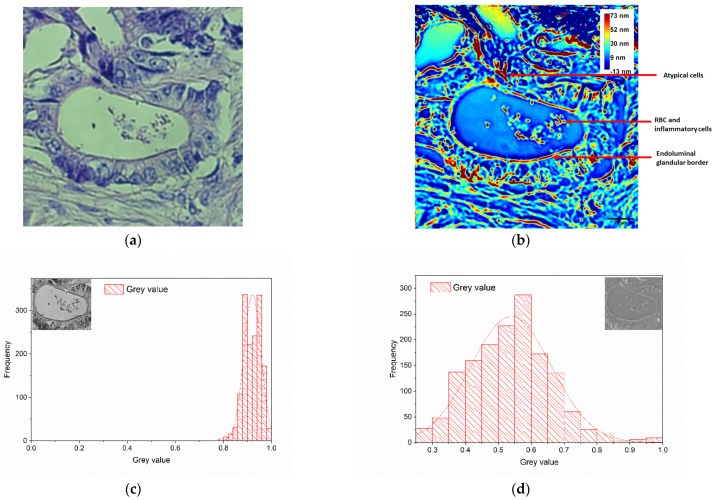
Figure 5.
Malignant colon tissue—H&E staining. (a) BF image taken with the inverted microscope (20×/0.4 NA objective); (b) phase map attained using the wDPM system, where color bar represents the optical pathlength through the specimen, in nm (pixels are saturated at 73 nm in order to enhance details in the ROI). Histograms of the collected signal (gray values) in the selected area are represented for images taken with the inverted microscope (c) and wDPM setup (d), respectively.

