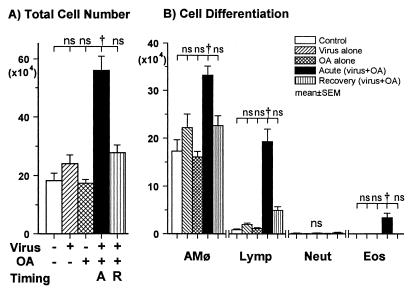
FIG. 1.
BALF cell analysis 48 h after the final OA challenge. (A) The total cell number in the acute phase group (closed column) was greater than the other four groups (P < 0.01; ANOVA). (B) The numbers of macrophages (AMφ), lymphocytes (Lymp), and eosinophils (Eos) in the acute phase group were greater than those of the other four groups (P < 0.01; ANOVA). The number of lymphocytes in the recovery phase group (vertical lines) was greater than that in the control (open), virus (hatched), and OA (cross-hatched) groups (P < 0.01; ANOVA). There were no differences in cell differentiation among the control, virus, and OA groups. Abbreviations: A, acute phase group; R, recovery phase group; Neut, neutrophils; †, P < 0.01 (comparison among groups); ns, not significant.

