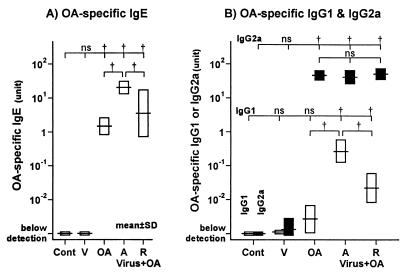
FIG. 2.
Serum levels of OA-specific IgE (A) or IgG1 (open bars) and IgG2a (closed bars) (B). In the acute phase group, the levels of OA-specific IgE and IgG1 were increased (P < 0.01; ANOVA). In the recovery phase group, the levels of OA-specific IgE and IgG1 were increased but lower than that of the acute phase group (both groups, P < 0.01; ANOVA). There were no differences in OA-specific IgG2a between the OA, acute phase, and recovery phase groups. In the control group, neither OA-specific IgG1, IgG2a, nor IgE was detected. Levels of immunoglobulins are expressed on a logarithmic scale. Cont, V, OA, A, and R denote the control, virus, OA, acute, and recovery phase groups, respectively. †, P < 0.01 (comparison among groups); ns, not significant.

