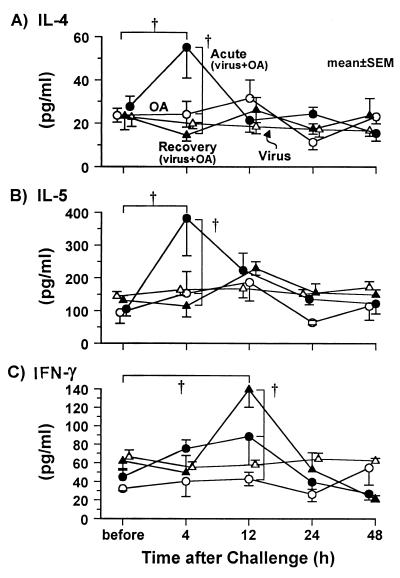
FIG. 3.
Cytokine profiles for IL-4 (A), IL-5 (B), and IFN-γ (C) in BALF before and after the antigen challenge. In the acute phase group (closed circles), the levels of IL-4 and IL-5 were increased by the antigen challenge (both groups, P < 0.01; ANOVA), but the levels of IFN-γ were not changed by the antigen challenge. In the recovery phase group (closed triangles), the levels of IFN-γ were increased by the antigen challenge (P < 0.01; ANOVA), but the levels of IL-4 and IL-5 were not changed. In both the OA group (open circles) and the virus group (open triangles), no changes in the levels of these cytokines were observed. †, P < 0.01 (comparison among groups, or comparison to the value before challenge).

