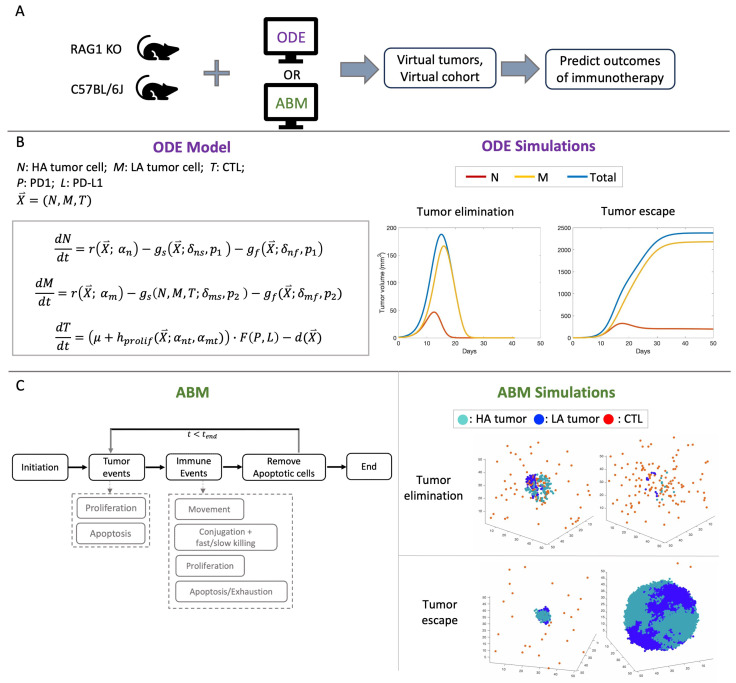
Figure 1.
(A) Simulation pipeline: In vivo data of RAG1 KO and C57BL/6J mice calibrate key parameters in the ODE model and the ABM to simulate virtual tumors and virtual cohort and predict therapeutic outcomes of anti-PD1 immune checkpoint inhibitors (ICIs). (B) Formulation of the ODE model and the temporal trajectories of tumor volumes after immune checkpoint blockade in “elimination” and “escape” cases. HA: high antigen, LA: low antigen. r: logistic growth of the tumor; : fast killing of the tumor cells; : slow killing of the tumor cells; : constant recruitment of CTLs per day; : antigen-stimulated proliferation of CTLs; F: immune suppression by the PD1-PD-L1 complex; d: death/exhaustion of CTLs. See [32] for exact formulation of the ODE model. See Table A2 for descriptions of key ODE parameters shown in this figure. (C) Simplified flowchart of the ABM and simulations of tumor elimination and tumor escape after immune checkpoint blockade. At each time step, each tumor cell can either proliferate or undergo apoptosis. Each CTL undergoes one of the four events: movement, conjugation with tumor cells to attach via fast or slow killing, proliferation, apoptosis, or exhaustion.

