Figure 3.
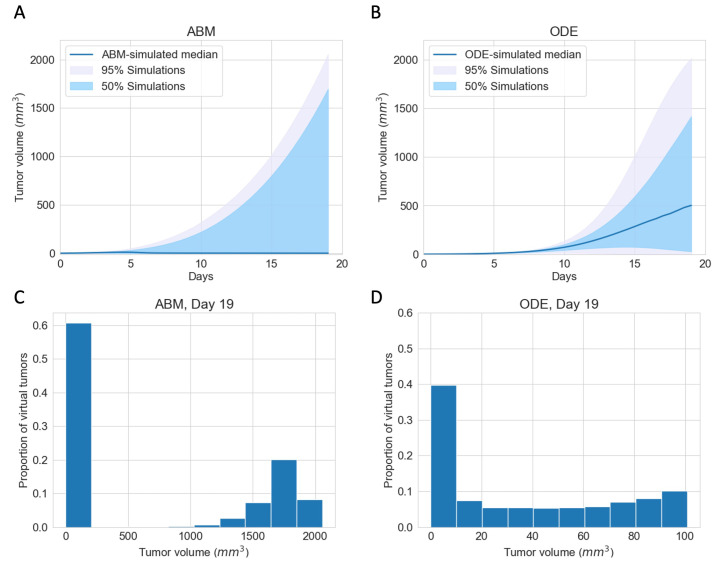
ABM and ODE virtual cohort simulations show a wide range of efficacies for immune checkpoint blockade therapy. (A) ABM simulations of virtual cohort response to ICI. (B) ODE simulations of virtual cohort response to ICI. Blue line: simulated median. Shaded grey region: 5 to 100 percentile of simulated tumor volumes on each day. Shaded blue region: 25 to 75 percentile of simulated tumor volumes on each day. (C) Histogram of ABM-simulated tumor volumes on Day 19. (D) Histogram of ODE-simulated tumor volumes on Day 19.

