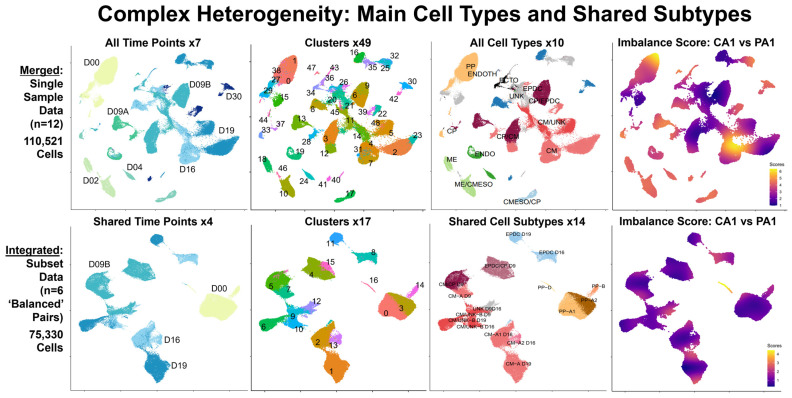
Figure 2.
Complex heterogeneity: main cell types and shared subtypes. Our scRNA-seq bioinformatics workflow included analyses of combined data: merged data (top panel) and integrated data (bottom panel). Each panel consists of four UMAP plots from left to right, with clusters marked and colored by time point, pre-annotation cluster number, main cell type or shared subtype, and imbalance score. To summarize results from our individual analyses, we created merged (non-integrated) data (top panel) by combining processed single-sample data for all 12 samples (110,521 total cells) across all seven time points: D00, D02, D04, D09A/B, D16, D19, and D30 (first plot). To compare Patient and Control samples, we created integrated data (bottom panel) by combining processed subset data for six pairs of ‘balanced’ cell types/subtypes (75,330 total cells) at four time points: D00, D09B, D16, and D19 (1st plot). Unsupervised clustering (2nd plots) found 49 clusters in merged data and 17 clusters in integrated data. Using known markers (3rd plots), we identified 10 major cell types: pluripotent cells (PP), mesendoderm (ME), cardiogenic mesoderm (CMESO), endoderm (ENDO), ectoderm (ECTO), endothelium (ENDOTH), cardiac progenitors (CPs), cardiomyocytes (CMs), epicardium-derived cells (EPDCs), and unknown (UNK) cells in merged data, as well as multiple possible shared subtypes in integrated data. Using condiments [51], we calculated the “Imbalance Score” of each cell to assess if nearby cells had the same condition (last plots). We defined ‘balanced’ cell types/subtypes, as shared cells with low imbalance scores, which were then selected for comparative analyses between Patient and Control cells.

