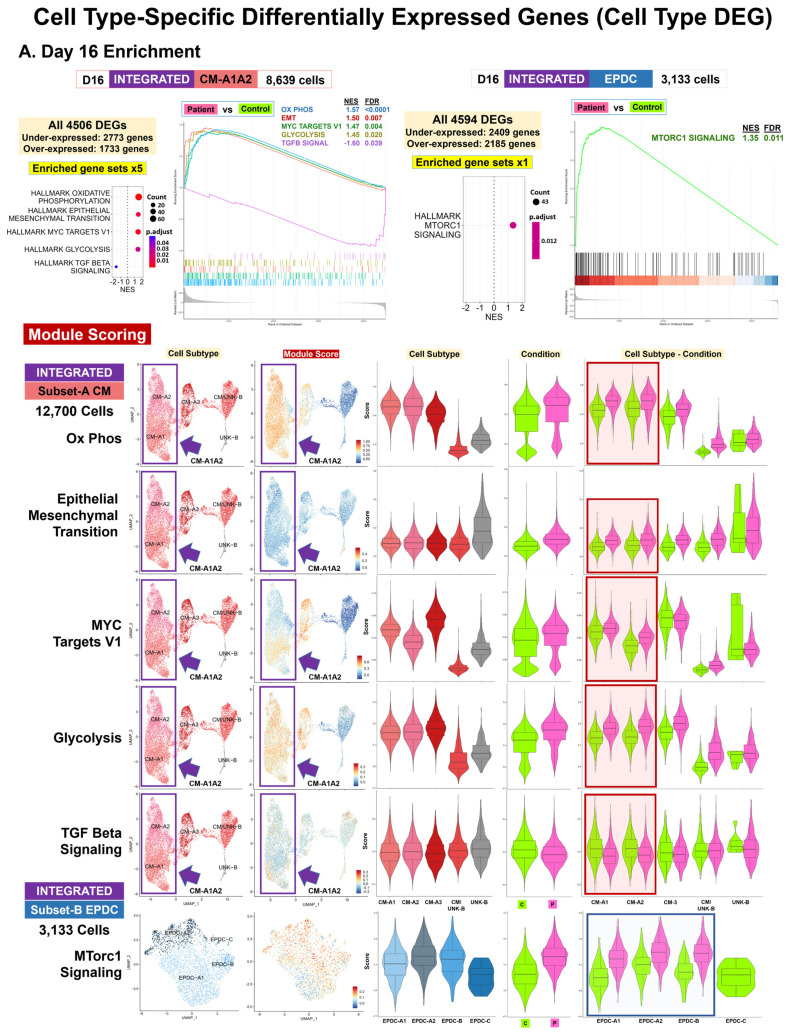
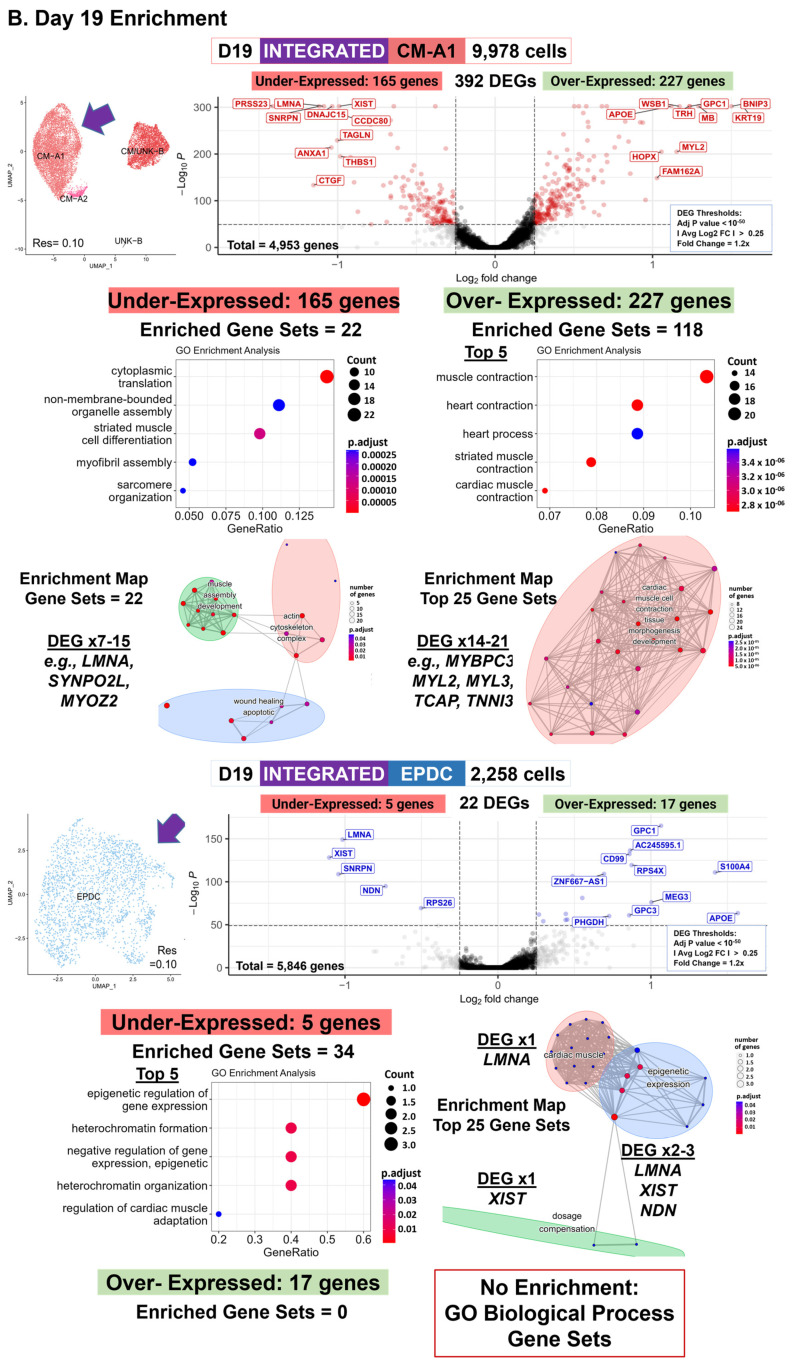
Figure 4.
Cell type-specific differentially expressed genes (cell type DEGs): enrichment. Our comparative analyses (Patient vs. Control cells) included cell type-specific differential expression and enrichment using integrated data at four time points: D00, D09B, D16, and D19. We identified cell type DEGs in 14 pairs of ‘balanced’ cell types/subtypes, with 71,541 total cells. (A) Day 16 enrichment. Shown are GSEA [61] results using Cluster Profiler [62] (top panel) for 8639 CM-A1A2 cells and 3133 EPDC, with numbers of DEG and enriched MSigDB Hallmark gene sets, dot plots with the normalized enrichment score (NES) and adjusted p-values, and GSEA enrichment plots. We used module scoring in Seurat (bottom panel) to compare the expression patterns of key DEGs in enriched gene sets for Subset-A data (12,700 CM) and Subset-B data (3133 EPDC). For each gene set, shown are UMAP plots with cell subtype and module scores, as well as violin plots with boxplot by cell subtype, condition, and cell subtype–condition. Overall, these results at Day 16 support the dysregulation of TGF Beta signaling, EMT developmental pathway, OXPHOS and glycolysis metabolism, and cell proliferation (via MYC target genes) in Patient CMs and mTORC1 signaling in Patient EPDCs. (B) Day 19 enrichment. Shown are cell type DEG results using Seurat and EnhancedVolcano [63] (top panels) and ORA [64] results using Cluster Profiler [62] (bottom panels) for 9978 CM-A1 cells and 2258 EPDC with the UMAP plot of cell subtypes, number of threshold DEGs, and volcano plot [63] with top ten DEGs labeled, number of under/overexpressed DEGs and enriched GO biological processes gene sets, dot plots with gene ratio and adjusted p-values, and enrichment maps. Overall, these results at Day 19 support the dysregulation of cardiogenesis, with both underexpressed DEGs, including LMNA, and overexpressed DEGs, including sarcomere genes, in Patient CMs, as well as epigenetic/heterochromatin dysregulation, with underexpression of XIST, NDN, and LMNA, in Patient EPDCs.


