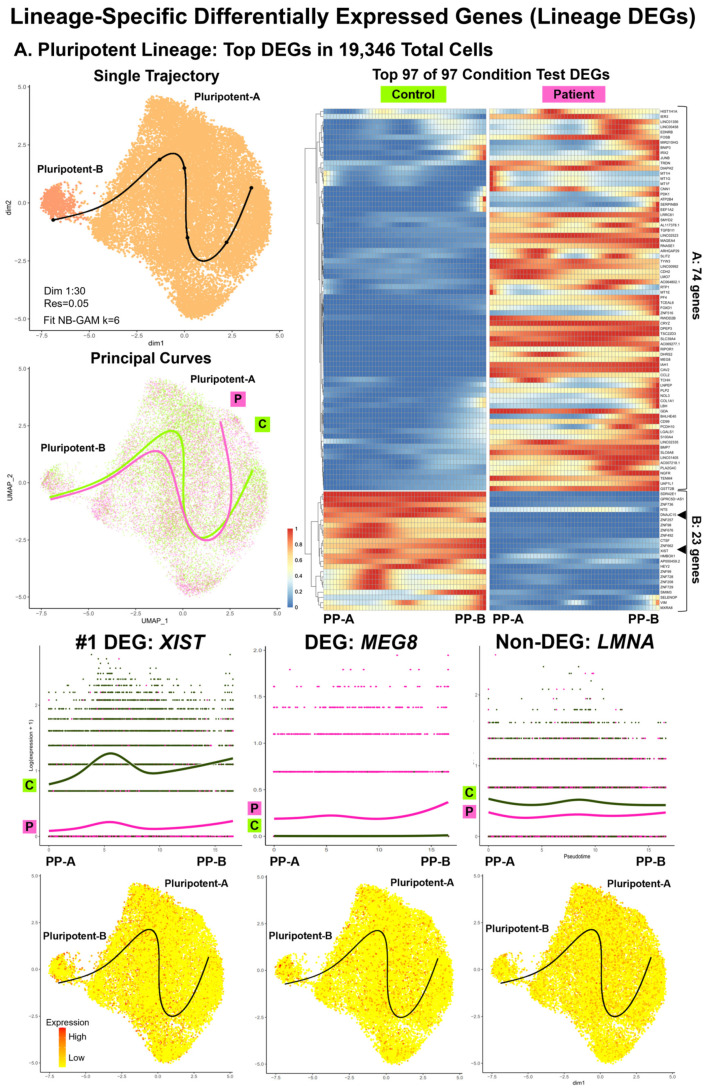
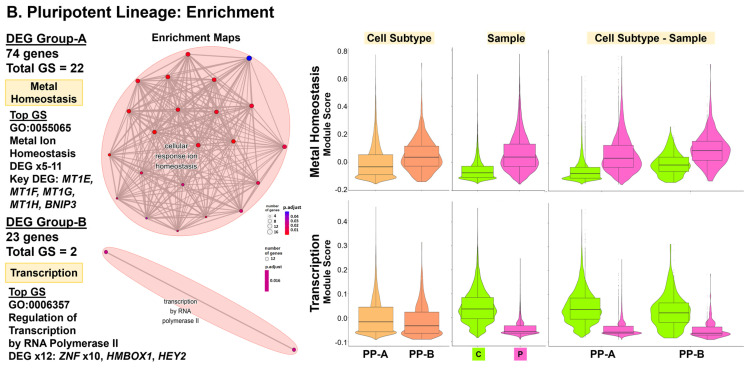
Figure 5.
Lineage-specific differentially expressed genes (lineage DEGs): top DEGs and enrichment for pluripotent lineage. Our comparative analyses (Patient vs. Control) included lineage-specific differential expression and enrichment using integrated data of 18 shared subtypes (62,488 total cells). This included D00 pluripotent (PP) subtypes for the PP lineage (19,346 total cells), a single trajectory from PP-A to PP-B. Shown are UMAP plots with trajectory and principal curves using Slingshot [65] (top left), a heat map by condition, along pseudotime points using pheatmap and condiments [51] (top right), and smoother plots and gene count plots using TradeSeq [66] (bottom). (A) PP Lineage: top DEGs in 19,346 total cells. We identified 97 conditional test DEGs that clustered into two groups: A (74 genes) and B (23 genes). Top DEGs included XIST (#1), underexpressed, and the imprinted gene MEG8, overexpressed in Patient PPs, along all pseudotime points. LMNA was not found as a lineage DEGs; however, LMNA expression was lower in Patient compared to Control PPs at all pseudotime points. (B) PP lineage: enrichment. Shown are ORA enrichment results using Cluster Profiler [62] (left panel) with DEG numbers by group and enriched GO BP gene sets (GSs), top GSs, key DEGs, and enrichment maps. To compare expression of key DEGs in enriched GSs, we used Seurat Module Scoring (right panel) and violin plots with boxplots. Results support dysregulation of metal homeostasis, with overexpression of 5 to 11 genes from DEG Group-A, including four metallothionein protein (MT) genes and RNA pol II transcription, with underexpression of 12 DEGs from DEG Group-B, including 10 Zinc-finger protein (ZNF) genes in Patient PPs.


