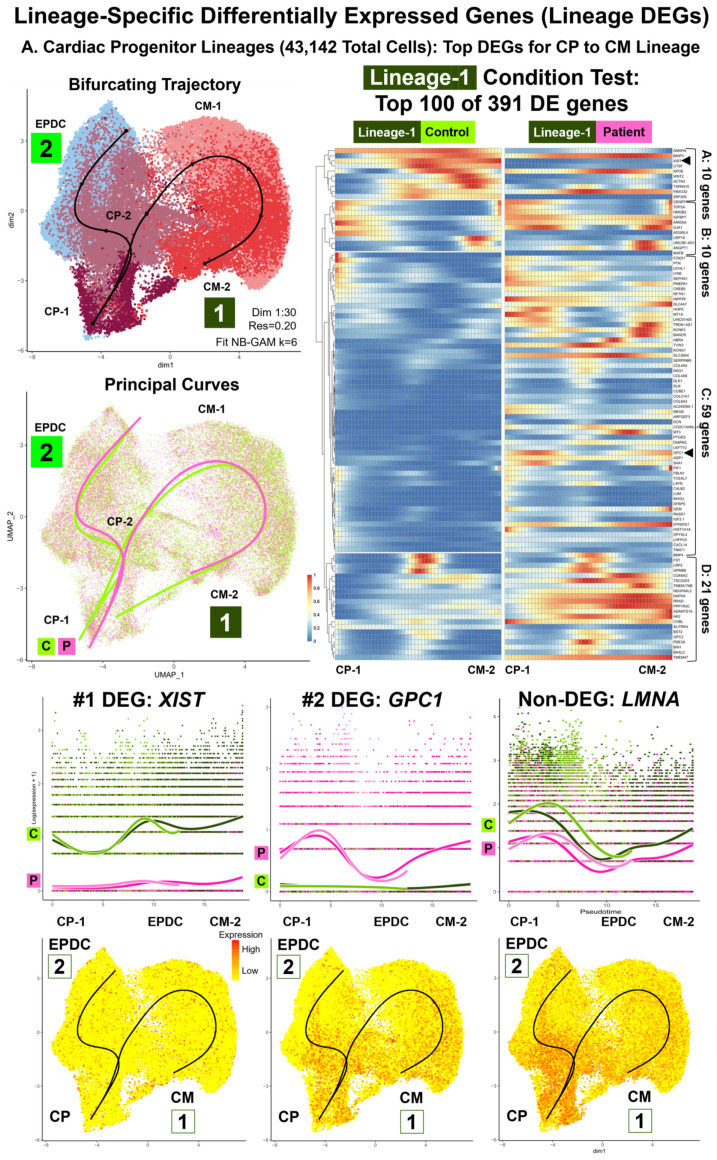
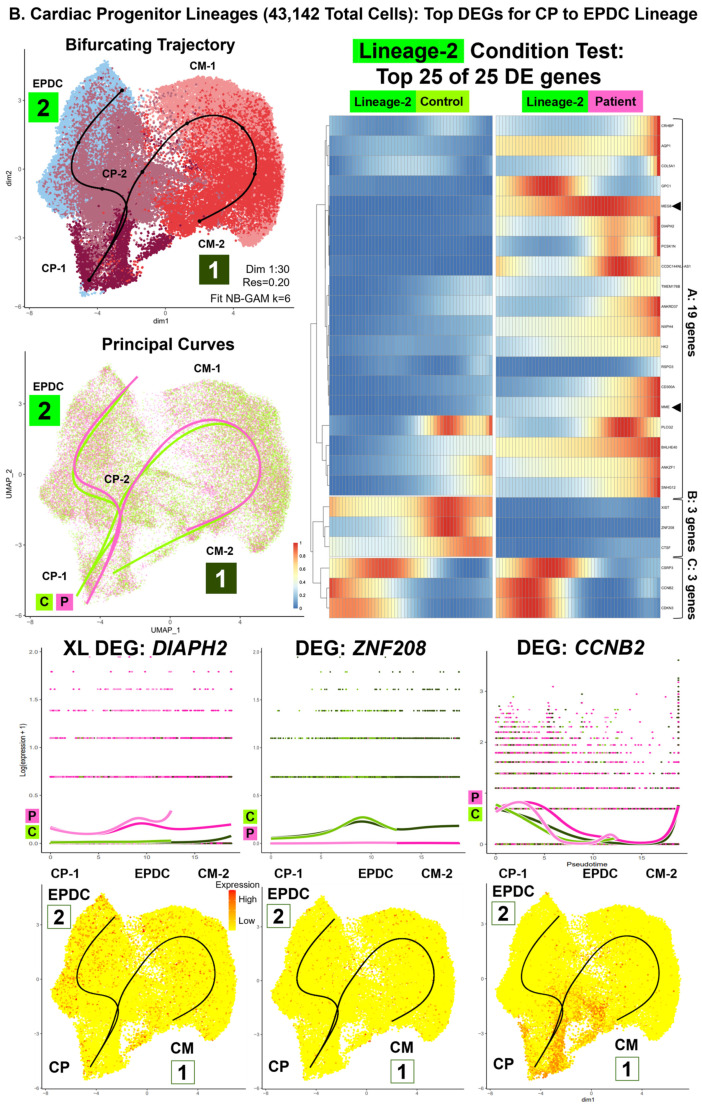
Figure 6.
Lineage-specific differentially expressed genes (lineage DEGs): cardiac progenitor lineages—top DEGs. Our comparative analyses (Patient vs. Control cells) included lineage-specific differential expression and enrichment using integrated data of 18 shared subtypes (62,488 total cells). This included D09B, D16, and D19 cardiac progenitor (CP), CM, and EPDC subtypes for the CP lineages (43,142 total cells), a bifurcating trajectory starting at CP-1 and ending at CM-2 (Lineage-1: CPs to CMs) and EPDCs (Lineage-2: CPs to EPDCs). Shown are UMAP plots with trajectory and principal curves using Slingshot [65] (top left), heat map by condition, along pseudotime points, using pheatmap and condiments [51] (top right), and smoother plots and gene count plots, using TradeSeq [66] (bottom). (A) CP Lineage-1: CPs to CMs—Top DEG. We identified 391 total conditional test DEGs, with the top 100 DEGs clustered into four groups: A (10 genes), B (10 genes), C (59 genes), and D (21 genes). The top DEGs included XIST (#1), underexpressed, and GPC1 (#2), overexpressed in Patient cells, along all pseudotime points. (B) CP Lineage-2: CPs to EPDCs—top DEGs. We identified 25 total conditional test DEGs that clustered into three groups: A (19 genes), B (3 genes), and C (3 genes). Top DEGs included XL DIAPH2, overexpressed, and ZNF208, underexpressed in Patient cells, along all pseudotime points and cell cycle gene CCNB2, overexpressed in Patient CP cells. Similar to the PP lineage, LMNA was not identified as a DEG in both CP lineages with lower expression in Patient compared to Control cells at all pseudotime points.


