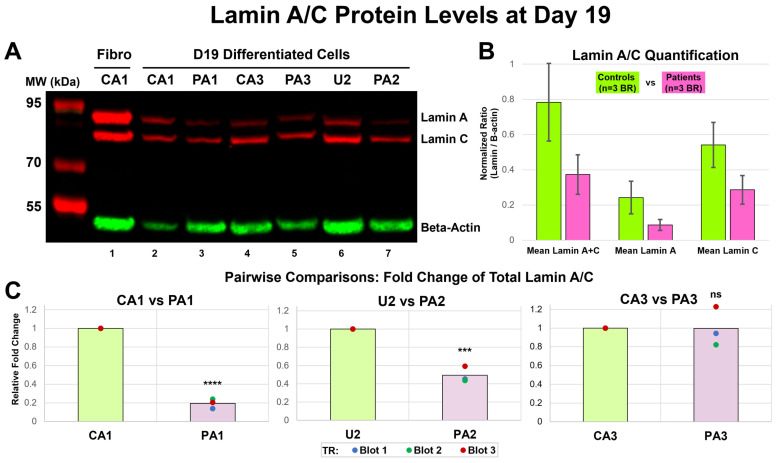
Figure 8.
Lamin A/C protein levels at Day 19. (A) Western blot (WB). We performed immunoblotting on lysates from differentiated cells with three biological replicates (BRs) at Day 19 for Patient (PA1, PA2, and PA3) and Control (CA1-B, U2, and CA3) iPSC lines. The image (Blot 3) shown was taken using the Azure c600 imaging system with fluorescent detection in red for Lamin A (74 kDa) and Lamin C (62 kDa) and in green for Beta-Actin (42 kDa) from Control fibroblast (CA1) (lane 1, positive control) and the three age- and sex-matched pairs: CA1 and PA1 (lane 2 and 3), CA3 and PA3 (lane 4 and 5), and U2 and PA2 (lane 6 and 7). Positions and sizes of molecular weight (MW) marker proteins are given on the left margin. (B) Lamin A/C quantification: Controls vs. Patients. We measured the band volume (BV) for Lamin A, Lamin C, and Beta-Actin using AzureSpot software (v2.2.167) and calculated normalized ratio (NR = lamin BV/Beta-Actin BV) of each sample (CA1-B, PA1, U2, PA2, CA3, and PA3) for three WB experiments (Blot 1–3) as technical replicates (TRs). Comparison of the Control (n = 3 BRs: CA1-B, U2, CA3) vs. Patient (n = 3 BRs: PA1, PA2, PA3) data showed a decrease in mean protein levels for Lamin A, Lamin C, Lamin A + C in the Patient, compared to Control cells; these differences were not statistically significant (p > 0.05). Error bars denote SD of the mean protein levels of BRs. (C) Pairwise comparisons: fold change of total lamin A/C. For each matched pair, we calculated fold change for Lamin A + C by dividing the Control and Patient protein levels by the Control protein level. Each chart shows the fold change from three TRs (Blot 1–3) as individual data points and mean fold change shown as column. Statistical analysis of the fold change revealed a significant decreases in protein level for Lamin A + C of PA1 (**** p < 0.0001) and PA2 (*** p < 0.001) but no significant difference for PA3 (p = 0.98) compared to matched Control.

