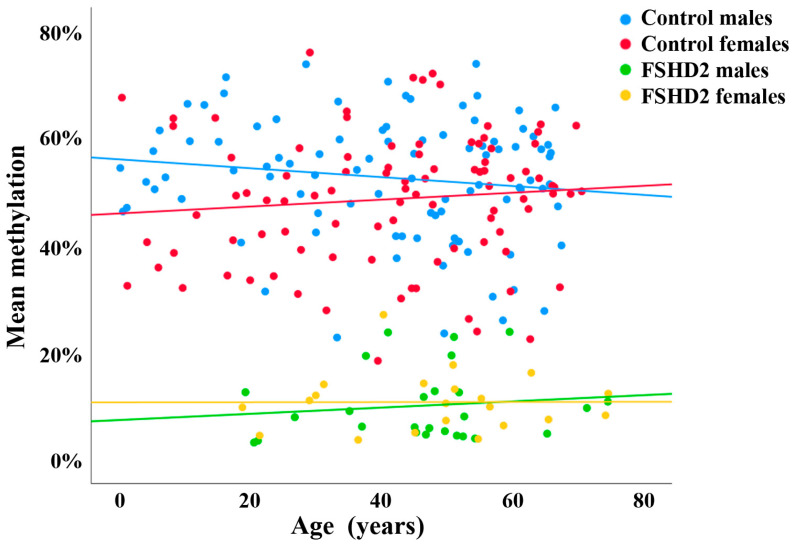
Figure 1.
Methylation variation of D4Z4 in healthy individuals and FSHD2 patients, determined using PBS. Scatter plot showing blood D4Z4 methylation levels in 94 male (blue dots) and 94 female (red dots) healthy controls, as well as in 27 male (green dots) and 21 female (yellow dots) FSHD2 patients. There is no age effect in controls and FSHD patients, respectively. However, there is significant hypomethylation in FSHD2 compared to controls.

