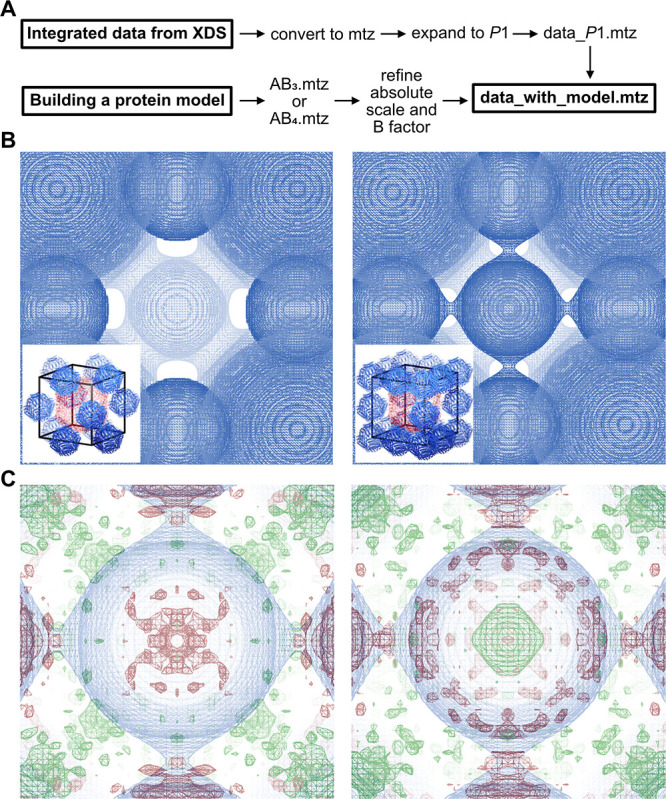
Figure 6.

Comparison of structure models and differences in density maps of AB3 and AB4 structures. (A) Workflow of data processing and refinement. (B) The electron density maps of the two models are depicted. For each model, the AB3 (left) or AB4 (right) unit cell is shown (inset). For comparison, the density is visualized at an r.m.s.d. of −0.207 e–/nm3 for the AB3 model and −0.220 e–/nm3 for the AB4 model. (C) Difference densities for the two structural types. The difference electron density for the AB3 data was overlaid with the density map of the AB4 model (left). Very little electron difference density (green) is observed around the protein shell, indicating that further density (= ferritin cage) is present. For the right panel, refinement with the AB4 model shows a lot of negative electron density (red) for the position of the fourth ferritin, indicating that too much electron density is present in the model. Difference electron density visualized at an r.m.s.d. at 1.6 e–/nm3.
