Figure 4.
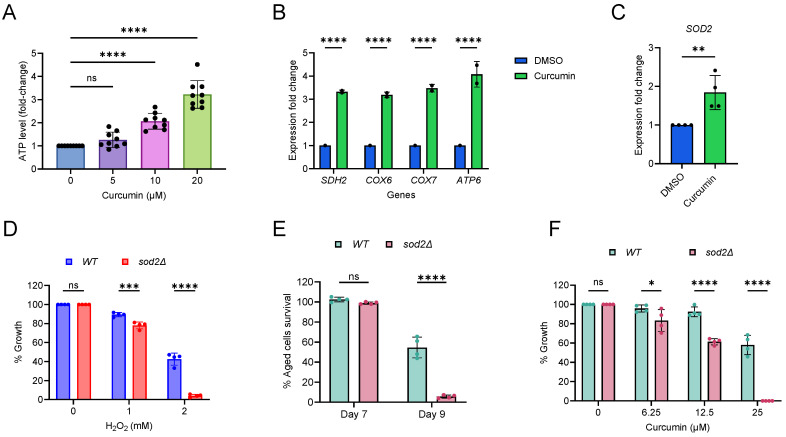
Curcumin enhances ATP levels and oxidative stress. (A) ATP analysis of yeast Saccharomyces cerevisiae genetic background CEN.PK113-7D wildtype cells treated with indicated concentrations of curcumin for one hour. The data are presented as means ± SD (n = 9). **** p < 0.0001, as determined by an ordinary one-way ANOVA followed by Dunnett’s multiple comparisons test. (B and C) Expression of (B) mitochondrial ETC genes and (C) SOD2 gene was analyzed by qRT-PCR of yeast cells treated with DMSO and curcumin (10 μM). Gene expression of curcumin-treated samples were compared with DMSO control. (B) Data are represented as means ± SD (n = 2) and **** p < 0.0001 based on a two-way ANOVA followed by Šídák’s multiple comparisons test. (C) Data are represented as means ± SD (n = 4) and ** p < 0.01 based on two-sided Student’s t-tests. (D,F) Growth assay of yeast wildtype cells exposed to (B) hydrogen peroxide (H2O2) and (C) curcumin at the indicated concentrations for 72 h. Growth was normalized to the untreated control. The data are presented as means ± SD (n = 4). Statistical significance was determined as follows: * p < 0.05, *** p < 0.001, **** p < 0.0001, and ns (non-significant) based on a two-way ANOVA followed by Šídák’s multiple comparisons test. (E) Lifespan of yeast wildtype and sod2∆-deletion postmitotic cells was evaluated in an SD medium using a 96-well plate. The survival of aging postmitotic cells was measured on day 7 and day 9, relative to the outgrowth of day 3. The data are presented as means ± SD (n = 4). Statistical significance was determined as follows: **** p < 0.0001 and ns (non-significant), based on a two-way ANOVA followed by Šídák’s multiple comparisons test.

